
Figures & data
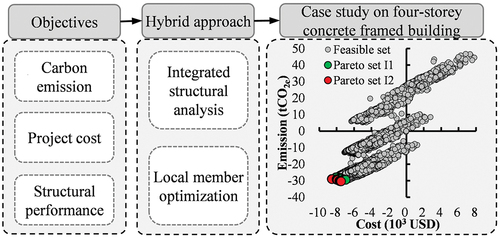
Figure 1. Research program of the present study.
Figure 2. Analytical procedure of the hybrid approach.
Table 1. Definition of the optimization problem on structural members.
Figure 3. Main processes of the harmony search algorithm.
Table 2. Assessment of the constraint violation (VI) for the optimization of bending beams.
Table 3. Engineering quantities based on subprojects for the initial building scheme.
Table 4. Building embodied emissions and costs of the initial scheme.
Figure 4. Comparison of the embodied emissions and relevant costs for structural components of the assessed building. “E” and “C” represent emissions and costs respectively.
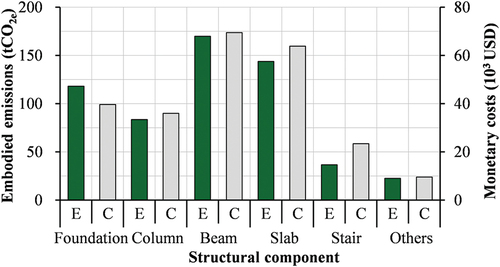
Figure 5. Trend of the maximum emission and cost reduction of the optimization results when the number of improvisations increases.
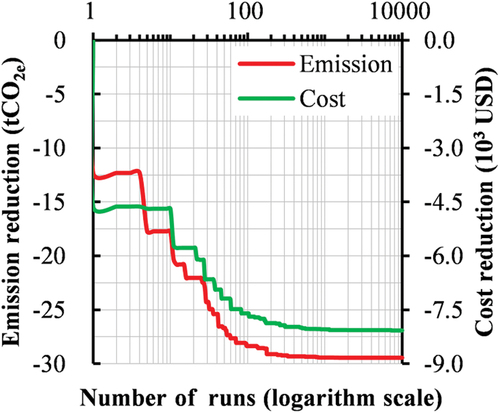
Table 5. Comparison of the optimization results for ten independent trials.
Figure 6. Optimization results of emission and cost reduction based on the harmony search algorithm. Figure 6b demonstrates a partial view of Figure 6a to make the Pareto fronts clear. I1 and I2 represent the first and the second stages of optimization; A, A1, B, C, and C1 are five representative Pareto-optimal solutions.
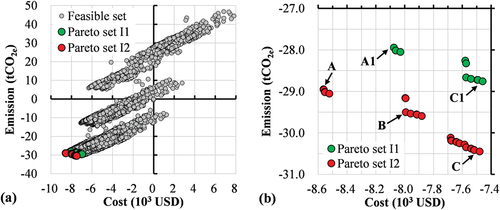
Table 6. Main design variables and results of representative solutions for beams optimization.
Data availability statement
Essential research data have been included in the published article. Further information is also available from the corresponding author on reasonable request.