Figures & data
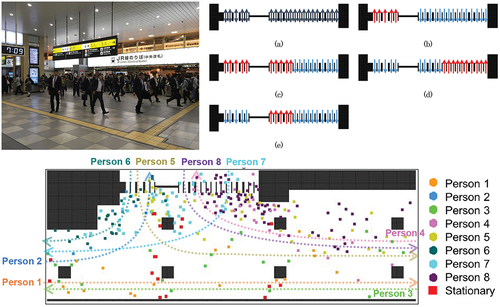
Figure 1. Japan railway Tennoji station concourse.
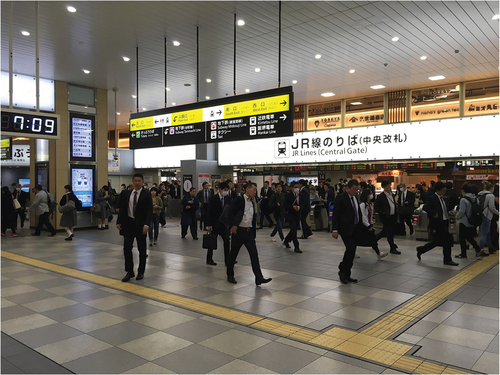
Table 1. Survey summary.
Figure 2. Number of people using Tennoji station (created by authors based on data from the Ministry of Land, Infrastructure, Transport and Tourism (Citation2022)).
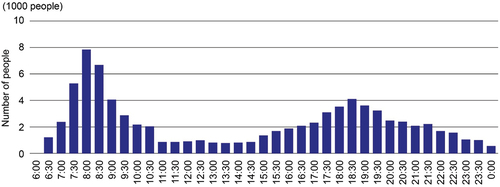
Figure 3. Map of Japan railway Tennoji station concourse and locations of survey.
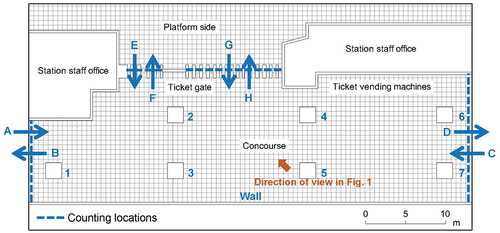
Figure 4. Average number of people flowing per minute during the commuting period.
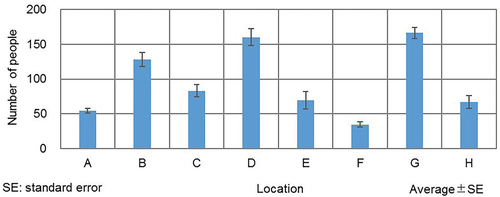
Figure 5. Average number of people flowing per minute during the non-commuting period.
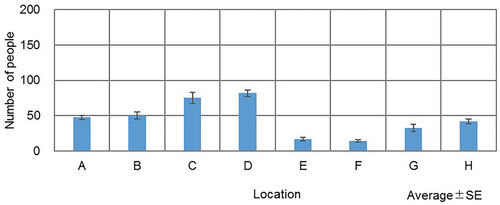
Figure 6. Comparison of the number of stationary people per minute according to time period.
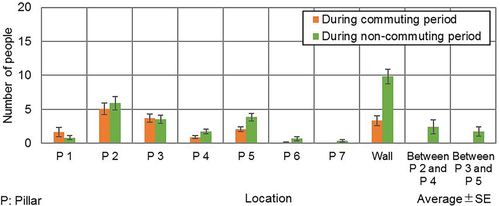
Figure 7. Generation/disappearance locations and paths of flowing agents, and generation locations of stationary agents.
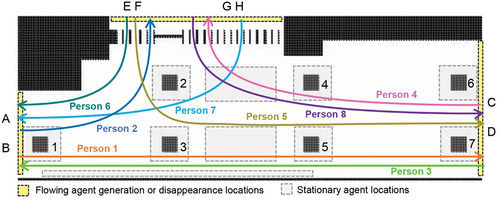
Figure 8. Chart of the agent-based modeling process.
Figure 9. Determining the direction of movement for a flowing agent (Moore neighborhood).
Figure 10. Avoidance behavior of a flowing agent.
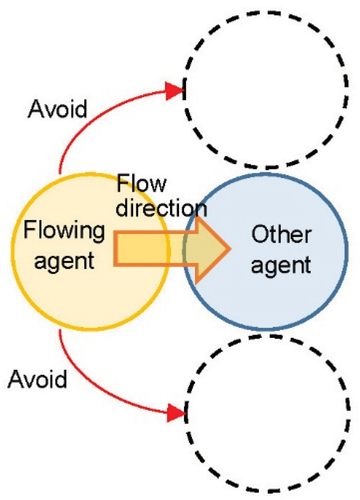
Figure 11. Diagram of three possible directions of flowing agent movement.
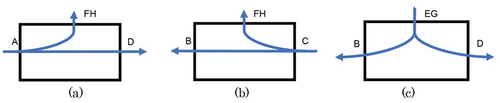
Figure 12. Observed directional restrictions at the ticket gates during the survey (a) commuting period and (b) non-commuting period.
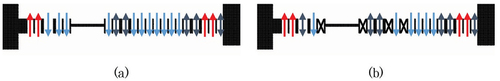
Table 2. Average number of flowing people per minute for each time period during the field survey.
Table 3. Numbers of flowing agents appearing per minute during the commuting period.
Table 4. Numbers of flowing agents appearing per minute during the non-commuting period.
Table 5. Average numbers of stationary people for each time period during the field survey.
Table 6. Error rate of the number of people or agents passing through the target station.
Figure 13. Walking time from the generation position to the destination.
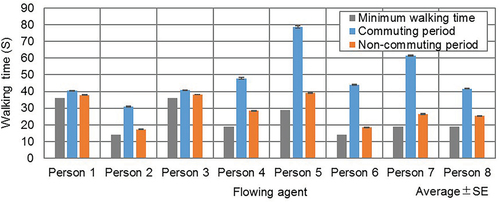
Figure 14. Simulated situation at a moment in time during the (a) commuting and (b) non-commuting periods.
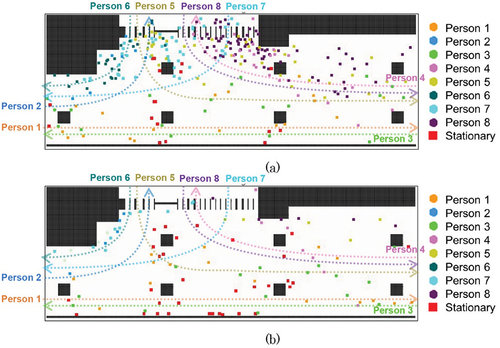
Figure 15. Flowing agent walking times according to the number of stationary agents during commuting hours.
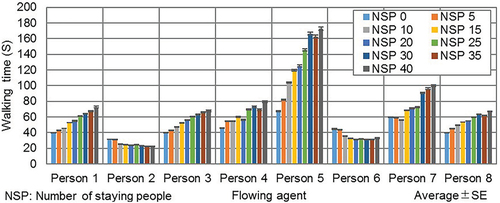
Figure 16. Simulated situation at a moment in time with (a) 0, (b) 15, and (c) 30 stationary agents.
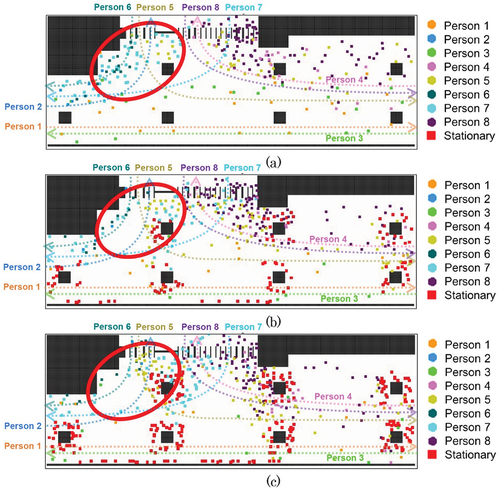
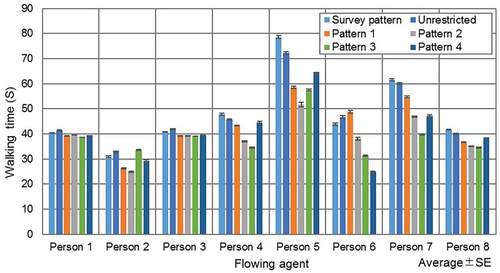
Figure 17. Evaluated ticket gate directional restriction patterns: (a) unrestricted, (b) Pattern 1, (c) Pattern 2, (d), Pattern 3, and (e) Pattern 4.
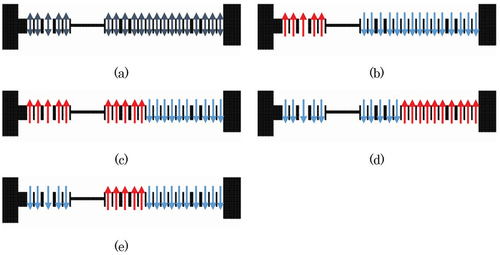
Figure 18. Flowing agent walking times according to ticket gate directional restriction pattern.