Figures & data
Figure 1. A Huoju Daoshi standing in front of his Namo Daoguan in the Guangdong area in the first years of Emperor Guangxu of the Qing Dynasty (Source: by Shuzhen Liu).
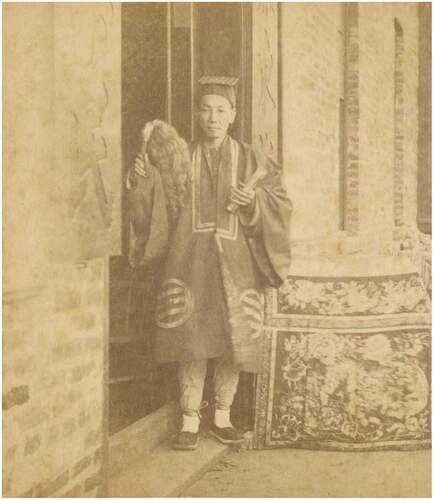
Figure 2. The picture shows the facade as well as the interior of the modern Hong Kong Zhengyi Namo Daoguan Fugui Hall. It inherits the tradition of the Huoju Daoshi in Guangdong Province and still provides ritual services such as praying for blessings and eliminating disasters for the city. (Source: photo by Author).
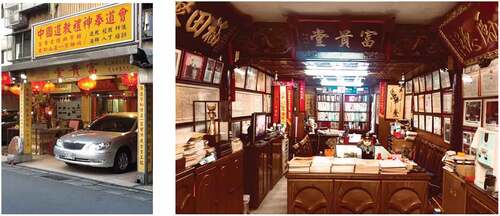
Figure 3. The plaque of Wu Daoguan in Macau and the portrait of its founder Wu Qingyun (Source: Government Information Bureau of the MSAR).
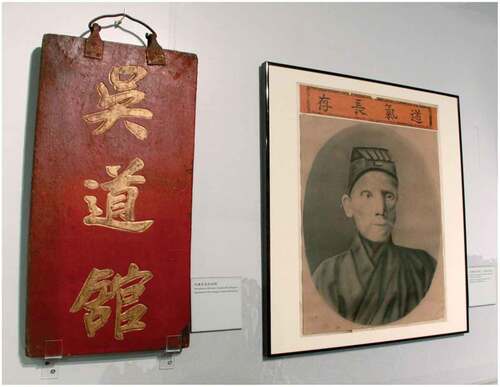
Figure 4. Master Liang Zhong led a group of disciples to perform in the open air during the Jiao-festival of the Lotus Land in Pat Heung. (Source: by Shujia Zhou).
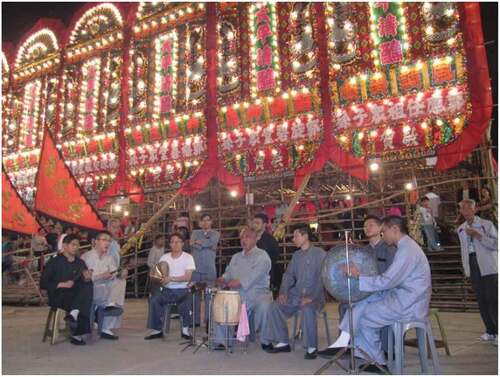
Figure 5. The centerline of a street road in the 37th year of the ROC. It can be seen that the layout of Guangzhou city and its surroundings, the density of the road network in different areas varies, the shape varies, and there is a large difference between areas. (Source: Drawn by author).
Figure 6. Distribution of Namo Daoguans and temples in Guangzhou during ROC period. From the map, we can see the number of Namo Daoguans and temples distributed under different partitions and the distribution relationship. We can also see the relationship between the distribution of Daoguans and waterways. (Source: Drawn by author).
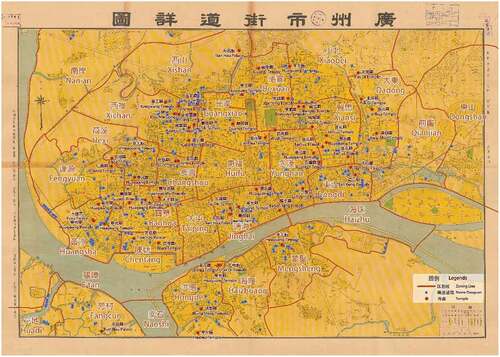
Figure 7. A Framework for the study of spatial distribution of Namo Daoguans (Source: Drawn by author).
Figure 8. The zoning number of Namo Daoguans in Guangzhou in the 18th year of the ROC (Source: Drawn by author).
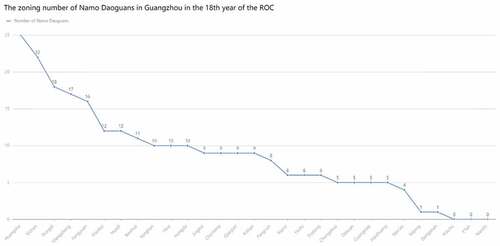
Figure 9. The zoning number of households in Guangzhou in the 18th year of the ROC (Source: Drawn by author).
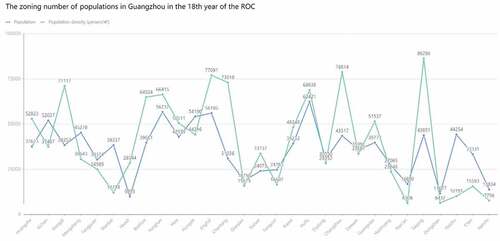
Figure 10. The zoning number of populations in Guangzhou in the 18th year of the ROC (Source: Drawn by author).
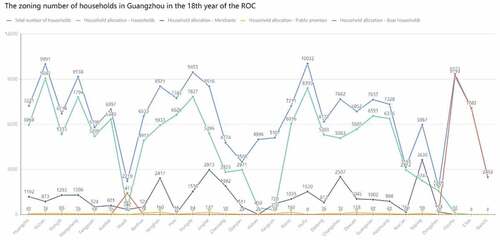
Figure 11. The zoning number of Namo Daoguans and temples in Guangzhou in the 18th year of the ROC (Source: Drawn by author).
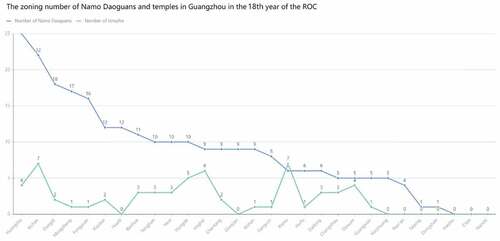
Figure 12. Analysis of the buffer zone of the temples and Namo Daoguans in Guangzhou (Source: Drawn by author).
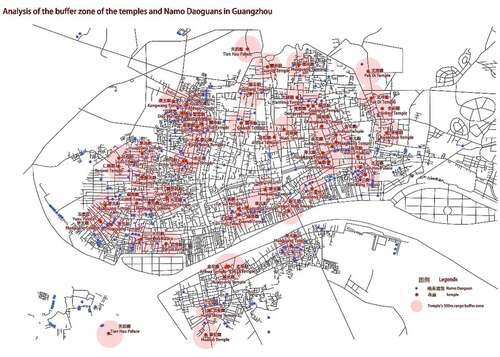
Figure 13. The Number of Namo Daoguans within 500 m of temples in Guangzhou in the 18th year of the ROC (Source: Drawn by author).
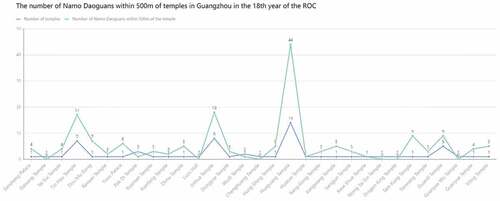
Figure 14. Percentage of Namo Daoguans located on streets with different degrees of integration in Guangzhou in the 18th year of the ROC (Source: Drawn by author).
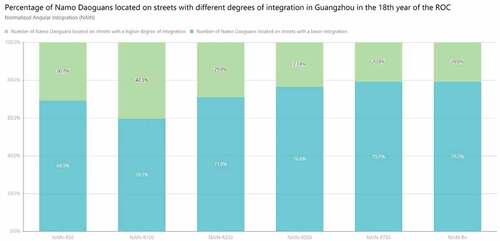
Figure 15. Percentage of Namo Daoguans located on streets with different degrees of choice in Guangzhou in the 18th year of the ROC (Source: Drawn by author).

Figure 16. INTEGRATION [SEGMENT LENGTH WGT]-Rn (Source: Drawn by author).
![Figure 16. INTEGRATION [SEGMENT LENGTH WGT]-Rn (Source: Drawn by author).](/cms/asset/6739b0e3-33eb-483f-9151-c032878eb3a9/tabe_a_2160209_f0016_oc.jpg)
Figure 17. NACH-R750 (Source: Drawn by author).
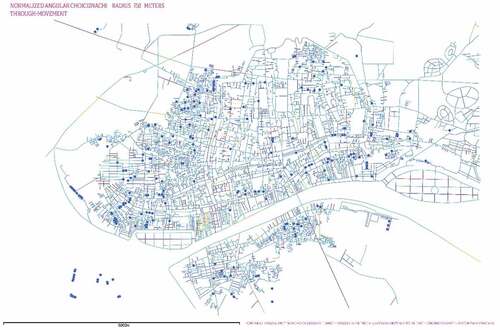
Table 1. Results of comparing the location of the remaining Namo Daoguans with the buffer zone analysis map (Source: Drawn by author).
Figure 18. COMBINING NAIN R100 & NACH R750 (Source: Drawn by author).
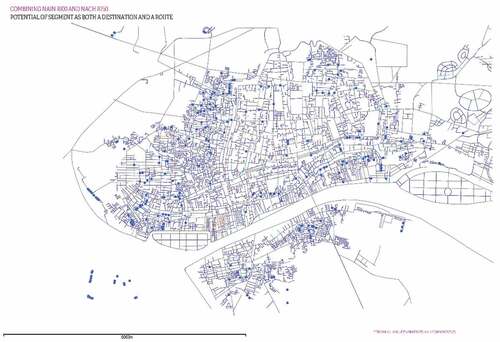
Figure 19. Site selection for Zhengyi Namo Daoguans in Guangzhou during the ROC period (Source: Drawn by author).
Figure A1. NAIN-R50 (Source: Drawn by author).
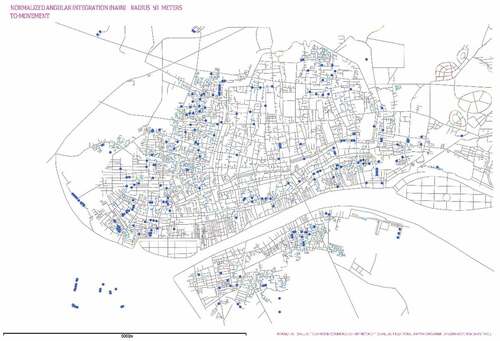
Figure A2. NAIN-R100 (Source: Drawn by author).
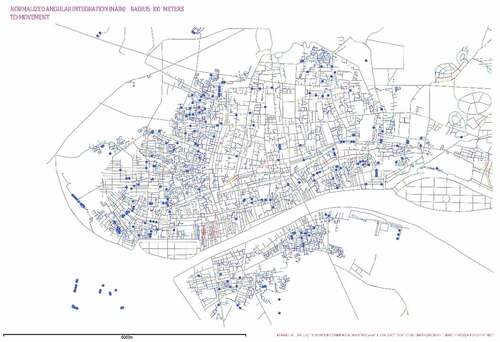
Figure A3. NAIN-R250 (Source: Drawn by author).
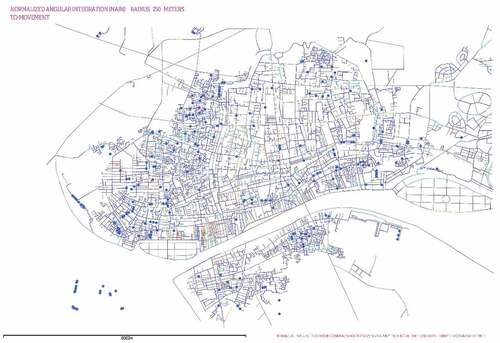
Figure A4. NAIN-R500 (Source: Drawn by author).
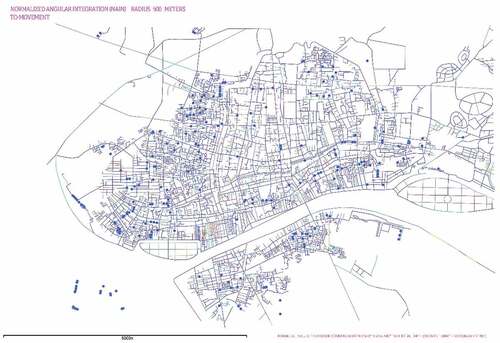
Figure A5. NAIN-R750 (Source: Drawn by author).
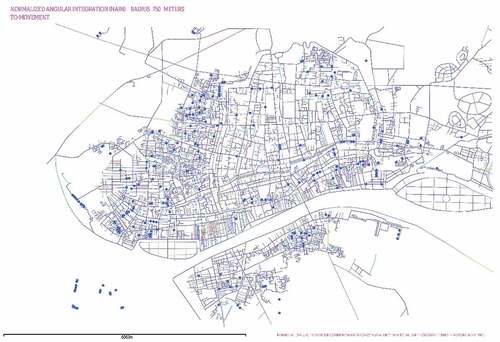
Figure A6. NAIN-Rn (Source: Drawn by author).
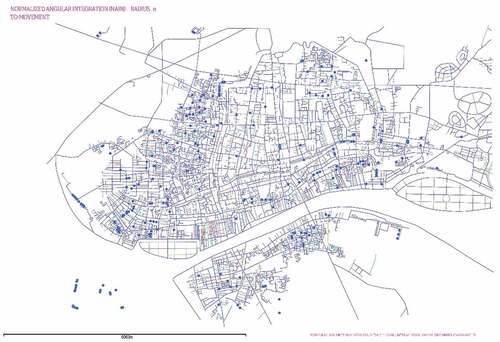
Figure A7. NACH-R50 (Source: Drawn by author).
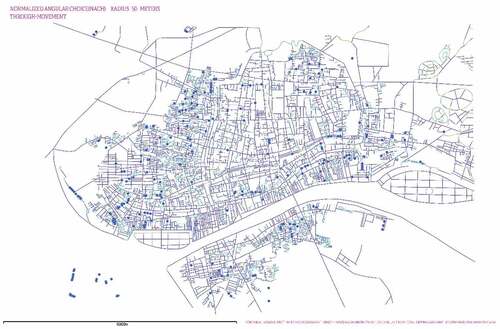
Figure A8. NACH-R100 (Source: Drawn by author).
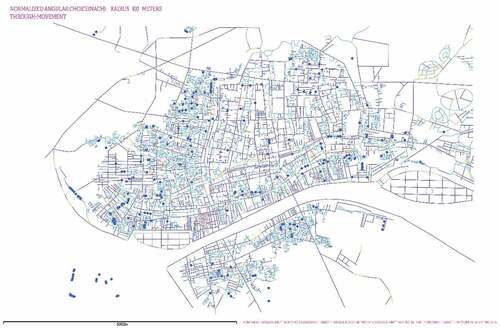
Figure A9. NACH-R250 (Source: Drawn by author).
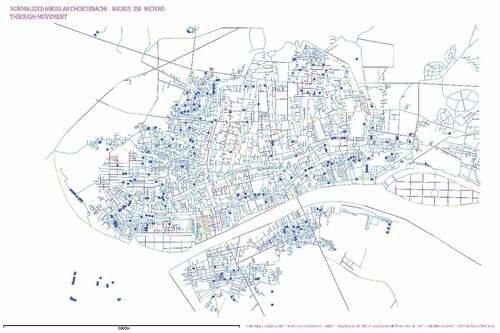
Figure A10. NACH-R500 (Source: Drawn by author).
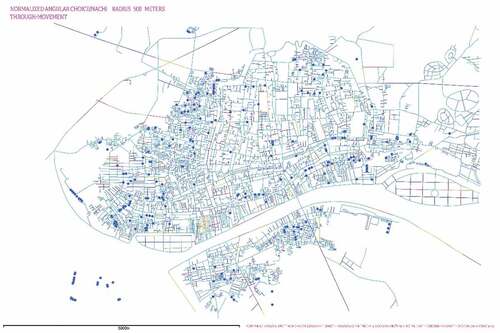
Figure A11. NACH-R750 (Source: Drawn by author).
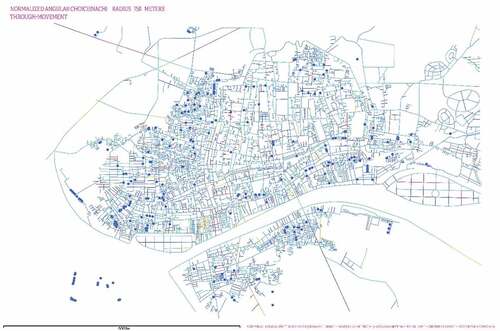
Figure A12. NACH- Rn (Source: Drawn by author).
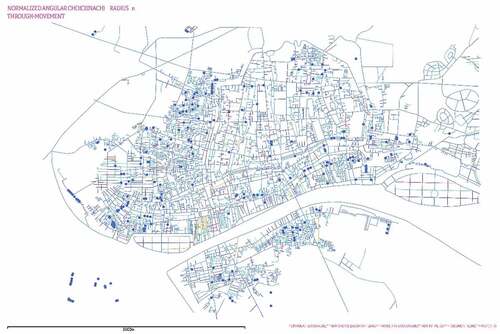
Figure A13. Detailed Street Map of Guangzhou (Source: printed by Sinomap Press in 1948).
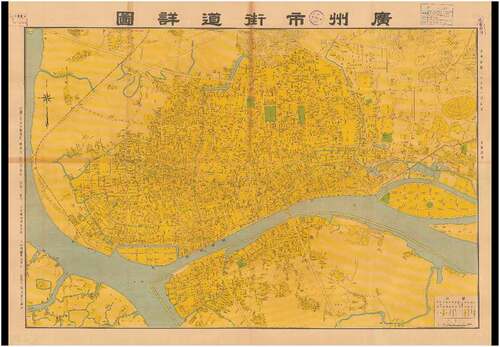
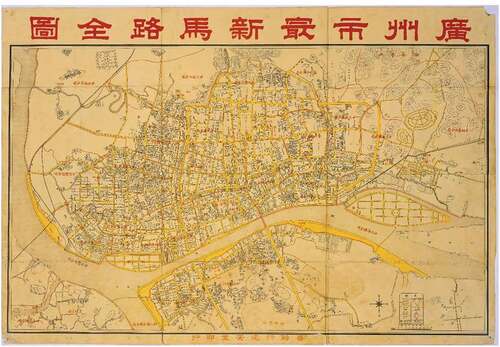
Figure A14. Newest Complete Map of Guangzhou City (Source: printed by the publisher Yuan’an Tang in the 26th year of the ROC).