
Figures & data
Figure 1. Electricity consumption by sector in Dubai 2017 (DEWA (Dubai Electricity and Water authority) Citation2017).
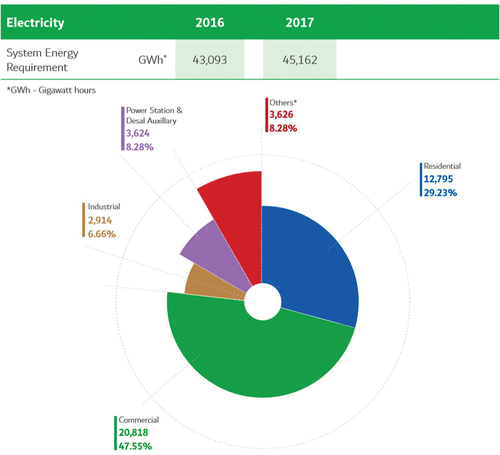
Table 1. Research Variables.
Figure 2. Details of a dynamic window (Source: Author).
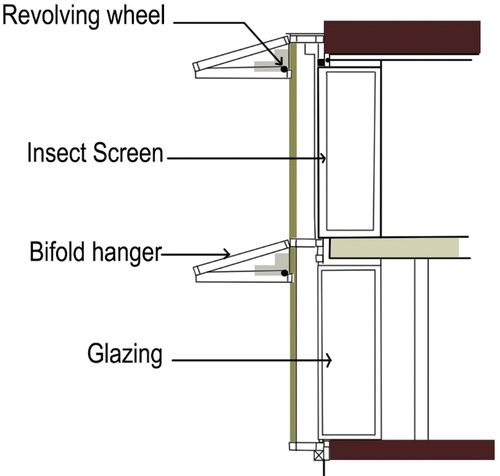
Figure 3. The location of the indoor and outdoor measurements with regard to the case study building.
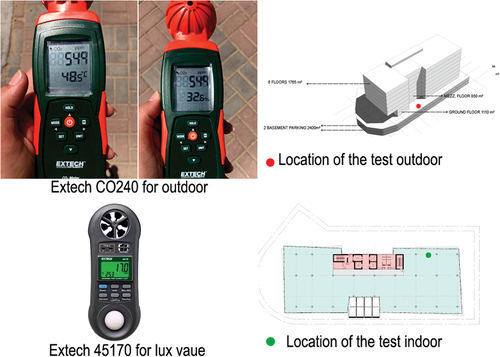
Figure 4. Discrepancy analysis of temperature (oC) between actual measurements and DIVA-for-Rhino.
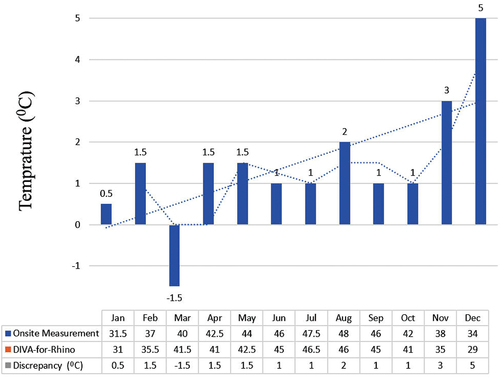
Figure 5. Discrepancy analysis of relative humidity (%) between actual measurements and DIVA-for-Rhino.
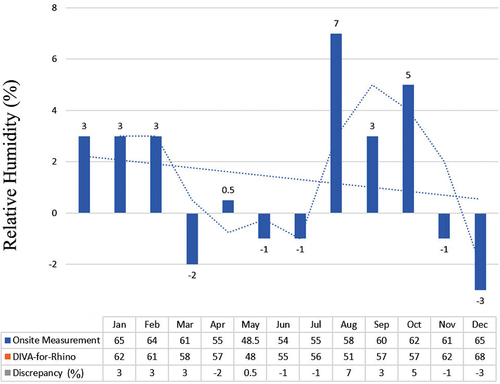
Figure 6. Discrepancy analysis of illuminance (lux) between actual measurements and DIVA-for-Rhino.
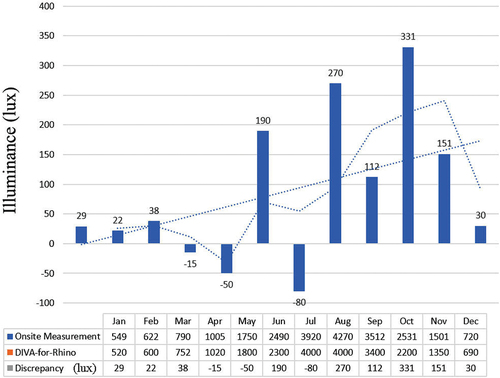
Figure 7. Discrepancy analysis of cooling load (kWh) between actual measurements and DIVA-for-Rhino.
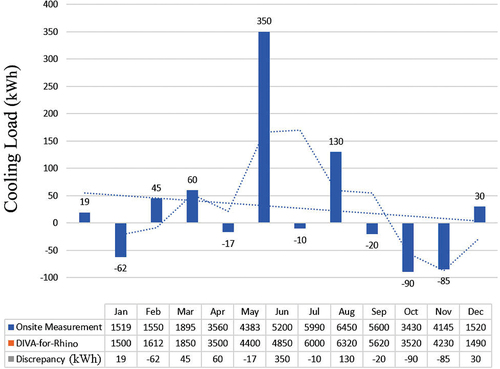
Figure 8. Kinetic Façade modelling for 90, 75, 60, 45, 30, and 15-degree folding.
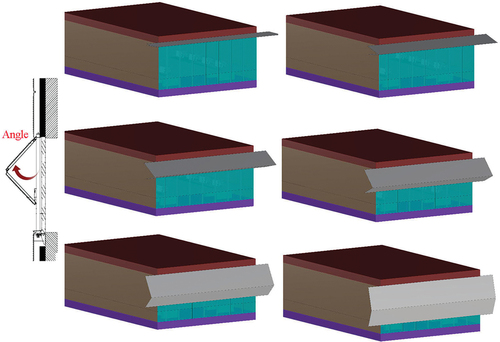
Figure 9. Annual Energy Consumption before and after application of the kinetic louver system.
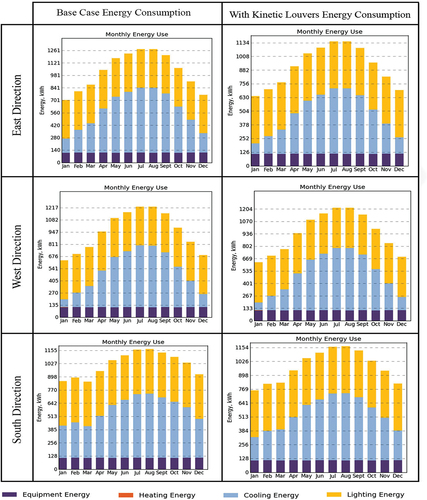
Table 2. Base Case “lux” Performance – East Direction.
Table 3. Base Case “lux” Performance – West Direction.
Table 4. Base Case “lux” Performance – South Direction.
Table 5. Kinetic Louver “lux” Performance – East Direction.
Table 6. Kinetic Louver “lux” Performance – West Direction.
Table 7. Kinetic Louver “lux” Performance – South Direction.
Table 8. Comparison of Luminance between Base Case and Kinetic Louvers.
Table 9. Workplane illuminance level of office zone in the Base Case (static shading at 90°) on South Façade on 15th August without artificial lighting.
Table 10. Workplane illuminance level of office zone in the Base Case (static shading at 90°) on South Façade on 15th August with artificial lighting.
Table 11. Workplane illuminance level of the office zone with kinetic folding on South Façade on 15th August without artificial lighting.
Table 12. Workplane illuminance level of the office zone with kinetic folding) on South Façade on 15th August with artificial lighting.