Figures & data
Figure 1. Zhejiang library in Hangzhou, China.
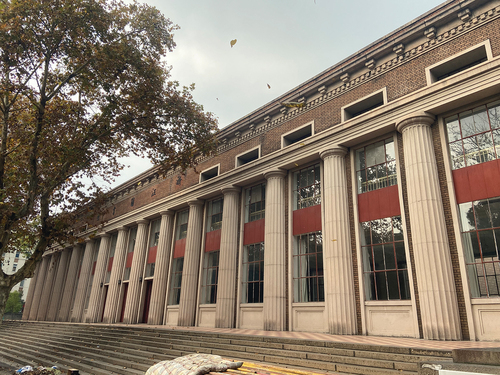
Figure 2. Illustration of sampling preparation (a) coring process (b) sampling locations.
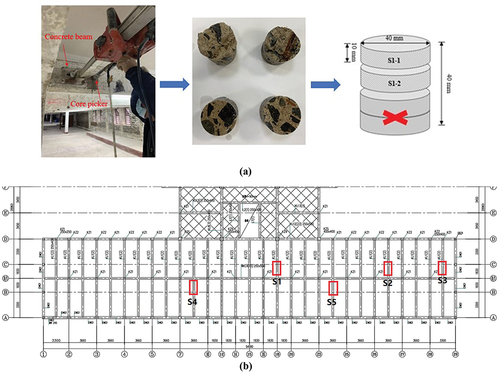
Table 1. Physical characteristics of concrete samples.
Figure 3. Cross section of sampling (a) macro morphology of concrete sample surface and (b) micro morphology of mortar.
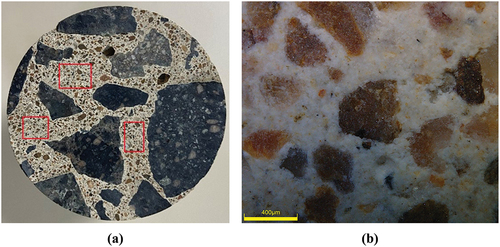
Figure 4. Specimens used for carbonation depth analysis.
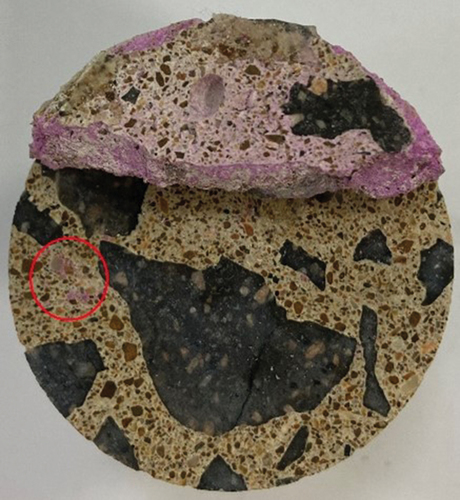
Figure 5. Experimental apparatus of oxygen diffusion measurement (Zhou, Jin, and Fu Citation2018). Legend: 1 = Concrete specimen; 2 = Epoxy resin; 3 = Rubber sealing gasket; 4 = Chamber tube wall; 5 = Intake valve; 6 = Move the piston; 7 = Piston seals; 8 = Stud bolts; 9 = Oxygen sensor; 10 = Oxygen concentration tester; 11 = Data logger; 12 = Gas catheter; 13 = Gas cylinders.
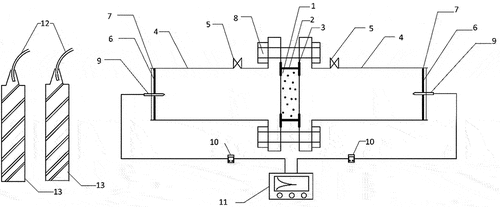
Figure 6. XRD patterns of five specimens (a) S1-S3 (b) S4-S5.
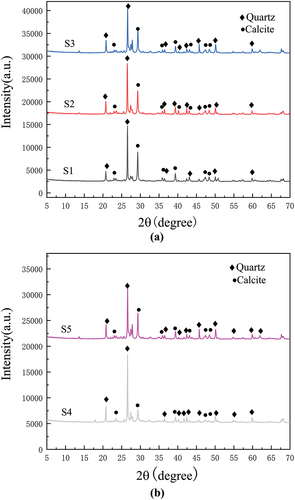
Table 2. Cement mortar compositions determined by XRD.
Table 3. Oxygen concentration gradient versus time fitting functions.
Table 4. Oxygen diffusion coefficients.
Table 5. Porosity values and pore size distributions of samples.
Figure 7. Plots used to determine the fractal dimensions of pore structures for two representative specimens (a) S1-1 (b) S1-2.
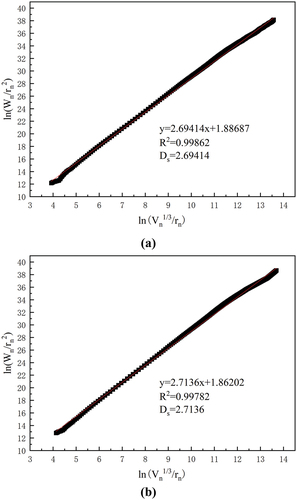
Table 6. Fractal dimensions of the pore structures.
Figure 8. Relationship between fractal dimension and oxygen diffusion coefficient.
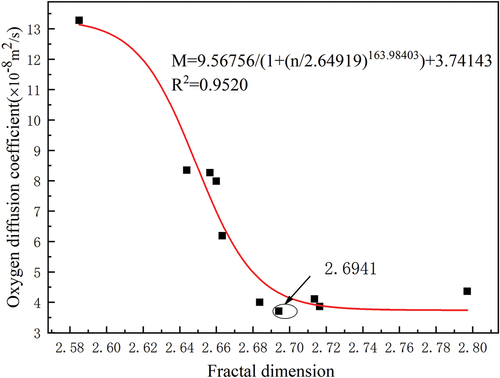
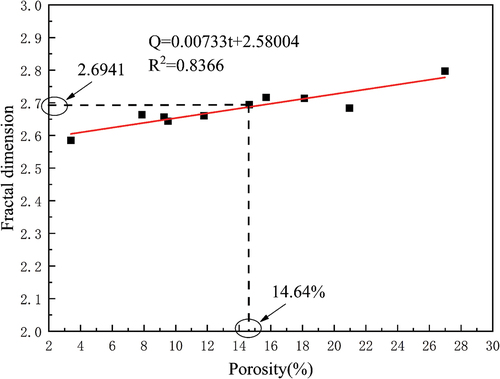
Figure 9. Relationship between the fractal dimension for the pore structure and the combined proportion of harmless and less harmless pores.