Figures & data
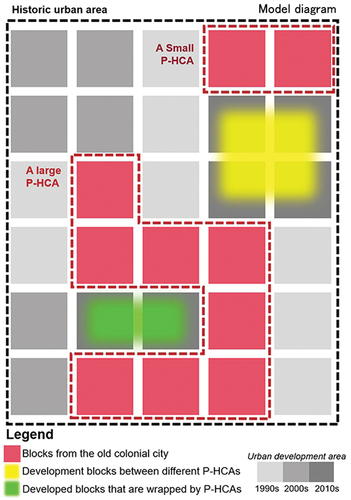
Figure 1. Research flow chart.
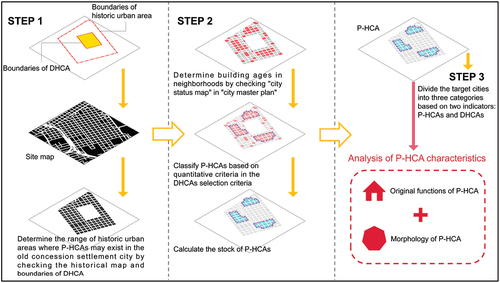
Figure 2. Principle of P-HCA classification.
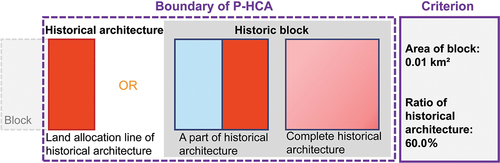
Figure 3. A case study of analysis process of P-HCAs (Dalian city).
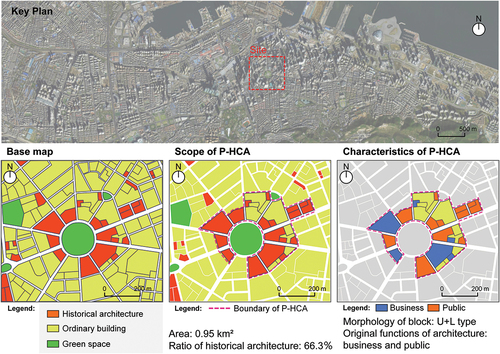
Figure 4. Location of the target cities, division of the concessions and leased territories, and boundary of the city in the National Famous Historical and Cultural City (NFHC-city) Conservation System.
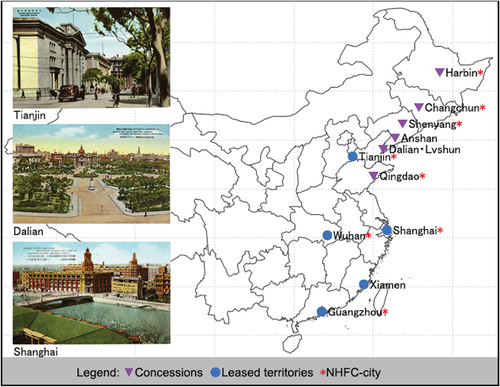
Table 1. Number and area of designated historic conservation area (DHCA), and the ratio of DHCA in the historic urban area.
Table 2. Categories for designation of historic conservation area (DHCA) (n = 43).
Figure 5. Locations of the designated historic conservation area (DHCA) and potential historic conservation area (P-HCA) in the target cities selected in this study.
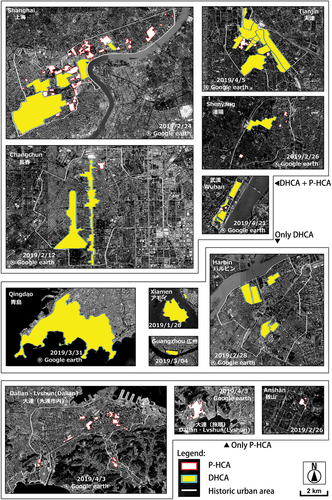
Table 3. Area of potential historic conservation area (P-HCA) in the target cities.
Figure 6. Types of cities based on designated historic conservation area (DHCA) and potential historic conservation area (P-HCA).
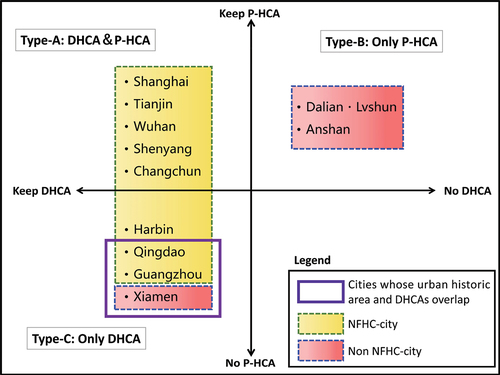
Figure 7. Initial functions of potential historic conservation area (P-HCA) in non-national famous historical and cultural city (non-NFHC-city).
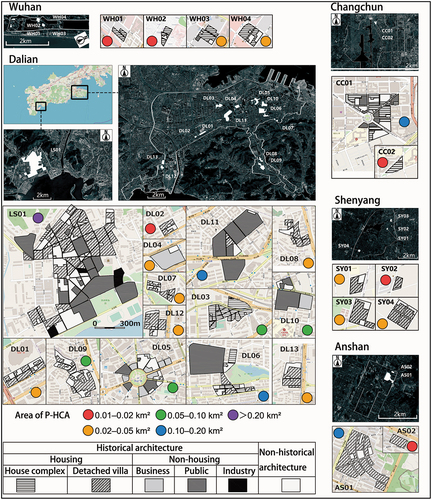
Figure 8. Initial functions of potential historic conservation area (P-HCA) in national famous historical and cultural city (NFHC-city).
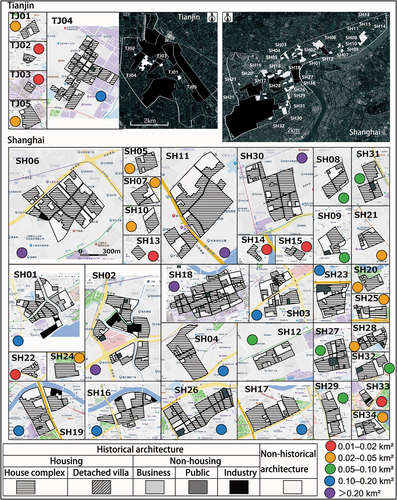
Figure 9. Area comparison of designated historic conservation area (DHCA) and potential historic conservation area (P-HCA).
Figure 10. Residential rate of potential historic conservation area (P-HCA) in target cities.
Figure 11. Characteristics of the potential historic conservation area (P-HCA), based on the indicators of the residential rate and area.
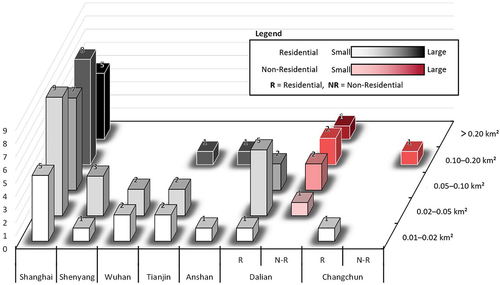
Table 4. Correlation between the morphology of block and block area.
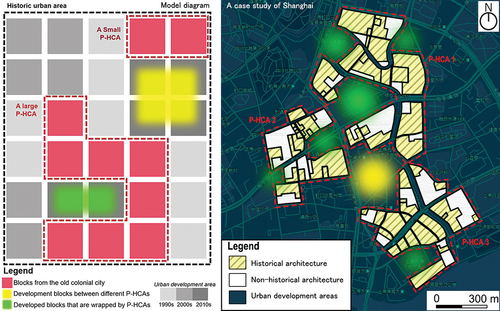
Figure 12. Model diagram and a case study of the relationship between potential historic conservation area (P-HCA) morphology and urban development.