Figures & data
Figure 1. Comparison of urban wind environment in China (a: Comparison of average wind speed in major cities in China; b: Comparison of calm wind frequency in major cities in China; c: Comparison of PM2.5 levels in some domestic cities in 2021).
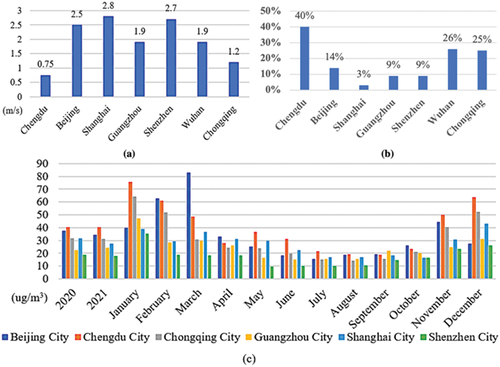
Figure 2. Timeline analysis burstiness pictorial based on related papers of Web of Science from 20,010,101 to 20,221,230.

Table 1. Planning nodes and characteristics of air environment in foreign representative cities.
Table 2. Cities’ relevant standards and guidelines for official action in China.
Figure 3. Keywords cluster pictorial analysis based on related papers of web of science from 20,010,101 to 20,221,230.
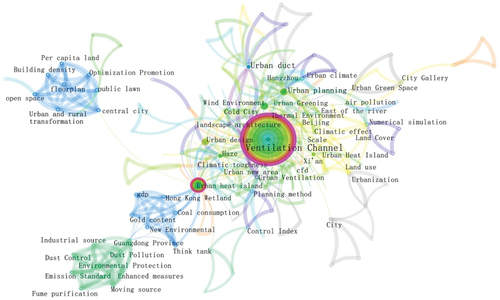
Figure 4. Keywords displayed together visual analysis based on related papers of web of science from 20,010,101 to 20,221,230.
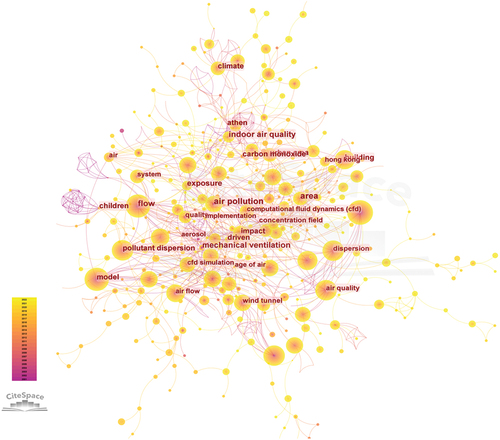
Figure 5. Technology roadmap.
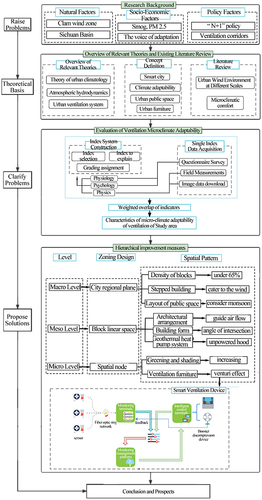
Figure 6. Indicator system (a: indicator selection principle; b: triarchic theoretical framework of urban street microclimate comfort based on dynamic physiological induction, dynamic physical environment, and psychological adjustment coupling interaction.).
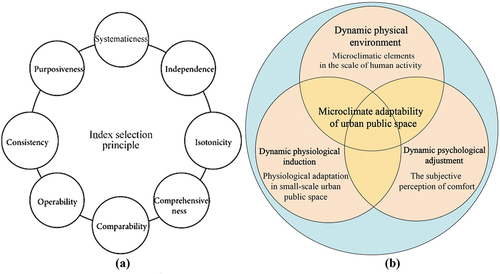
Table 3. The classification and assignment of each index of the comprehensive evaluation of microclimatic wind environmental adaptability.
Table 4. Construction of judgment matrix of the structural model for assessing microclimatic wind environmental factors.
Table 5. The result of the judgment Matrix of the structural model for assessing microclimatic wind environmental factors.
Figure 7. Hierarchical structure model.
Table 6. The design elements correspond to different wind environment problems and the optimization goals of the wind environment.
Figure 8. Urban ventilation furniture case.
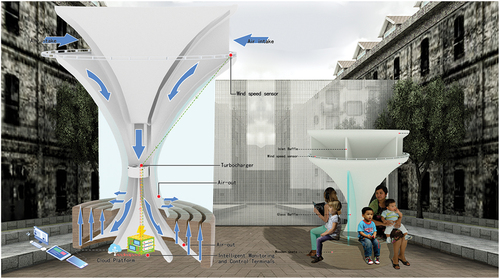
Table 7. The analysis of the ventilation-adapted layout of the public spaces at Eastern Banlieue memory industrial park.
Figure 9. Eastern Banlieue Memory park field investigation record (a: The status of roads in the eastern Banlieue s memory area; b: The current situation of memory greening in the eastern Banlieues; c: Height map of the eastern Banlieue s memory building; d: Eastern Banlieue Memory questionnaire area point).
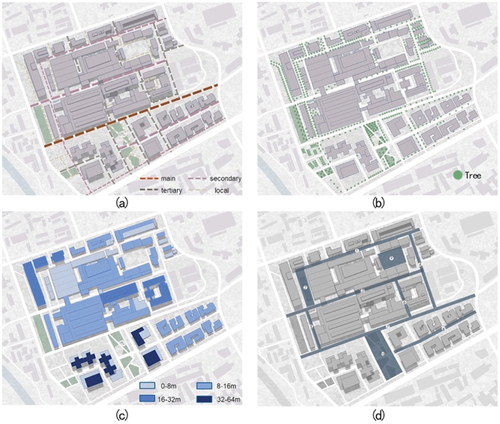
Figure 10. The measured data in Eastern Banlieue memory industrial park.
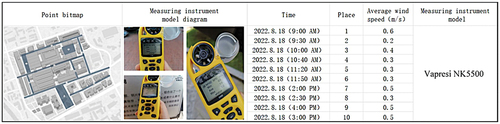
Figure 11. Temperature and wind speed maps of Chengdu in 2022 (a: Wind speed in Chengdu month by month in 2022; b: Hourly temperature in the 24-hour month by month, August 18th, 2022; c: Hourly wind speed in 24-hour, 2022; d: Hourly temperature in 24-hour, August 18th, 2022).
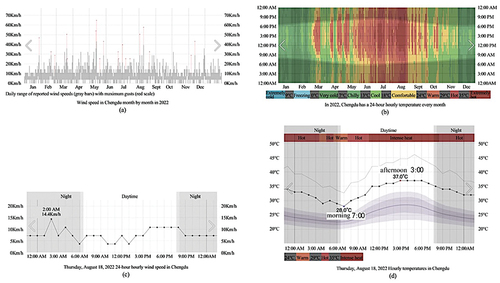
Figure 12. Questionnaire results (a: study the relationship between wind speed at different points and wind speed felt by the human body; b: study the relationship between humidity at different points and the human body’s perceived humidity; c: the relationship between temperature and thermal sensation at different study points).
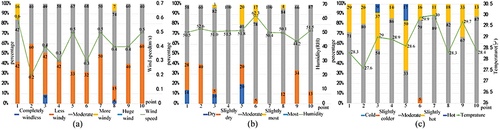
Table 8. Results evaluation indicators combine pedestrians’ wind speed with the relative static wind speed of air pollutants.
Figure 13. Analyses of wind environment by using Phoenics software (a: Phoenics software interface diagram.B: wind speed simulation at 1.5m pedestrians height in the study area).
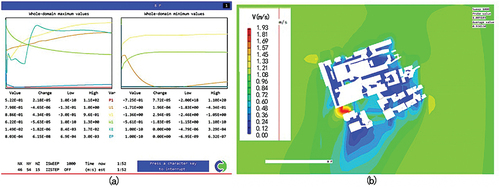
Figure 14. Installation layout point map.
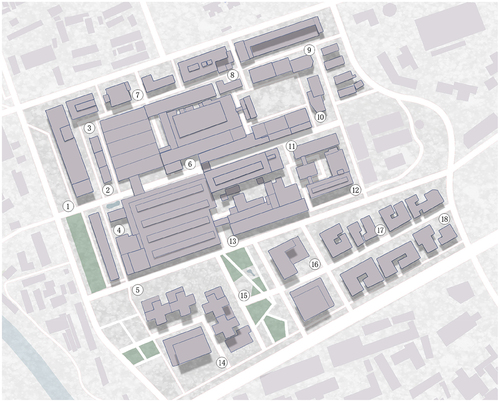
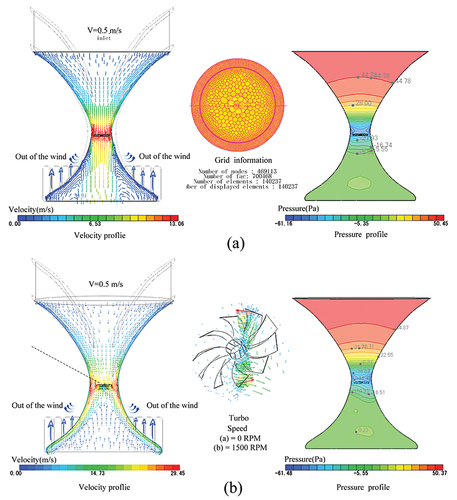
Figure 15. Working status of ventilation seat. (a: without turbo; b: with turbo).