
Figures & data
Figure 1. Liang’s 1D impedance model (Moharana, Citation2012).
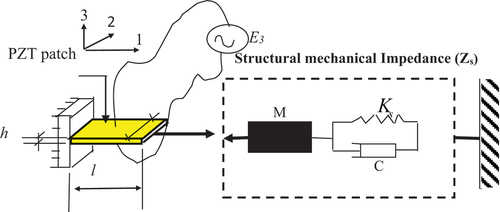
Figure 2. Deformation in bond layer and PZT patch (Moharana, Citation2013).
Figure 3. Aluminium host structure with bonded PZT patch.
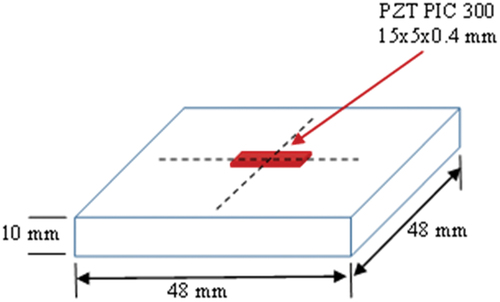
Table 1. Key parameters of the PZT patch.
Table 2. Key material properties of the host structure.
Figure 4. Sn-Ag bonding procedure.
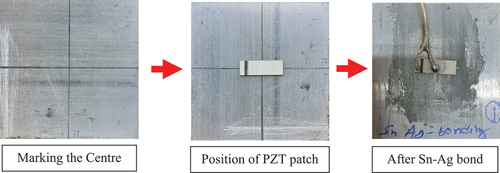
Figure 5. Themo-mechanical activation of Sn-Ag alloy.
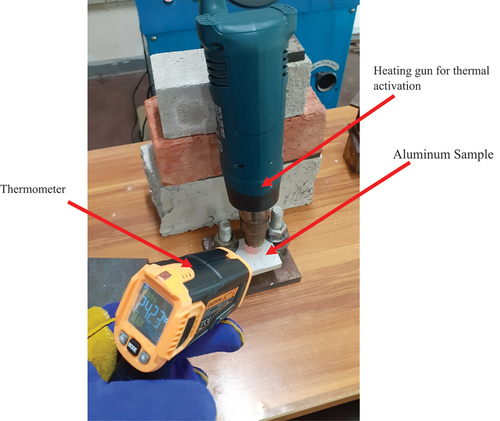
Figure 6. Complete experimental set-up.
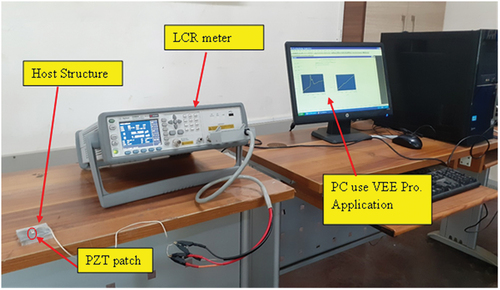
Figure 7. Degradation of bond geometry for adhesive bond interlayered between PZT patch and structure.
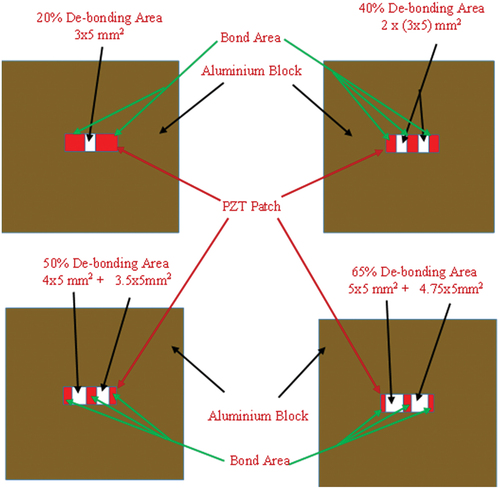
Figure 8. Laboratory-sized aluminium sample instrumented with PZT patch through Sn-Ag alloy bonding. a)complete bonding area b)20% De-bonding c)40 % De-bonding d)50 % De-bonding e)65 % De-bonding.
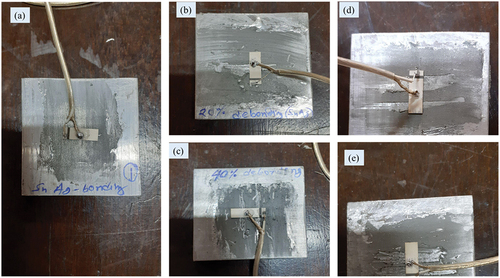
Figure 9. Laboratory-sized aluminium sample instrumented with PZT patch through epoxy bonding. a)complete bonding area b)20% De-bonding c)40 % De-bonding d)50 % De-bonding e)65 % De-bonding.
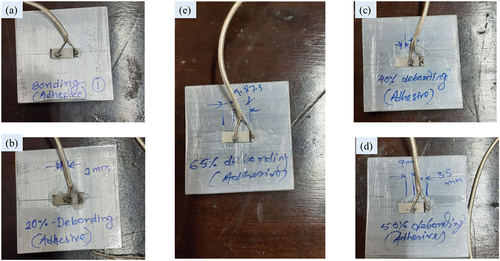
Figure 10. Moisture curing : specimens immerse in water.
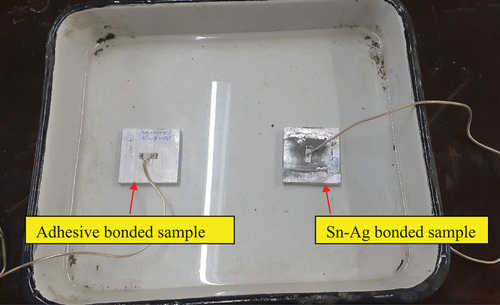
Figure 11. Moisture effect study in a water bath. a) water bath b) aluminum samples with specimen holder c) aluminum samples immersed in a water bath.
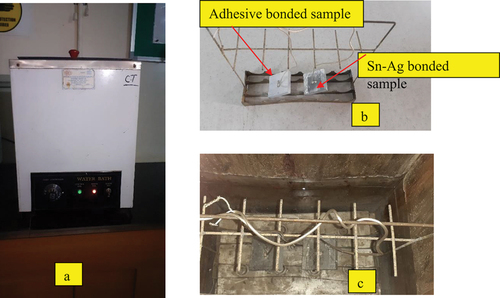
Figure 12. Study of the temperature effect with the help of the hot air oven. a) oven b) aluminium samples kept in an oven for thermal exposure.
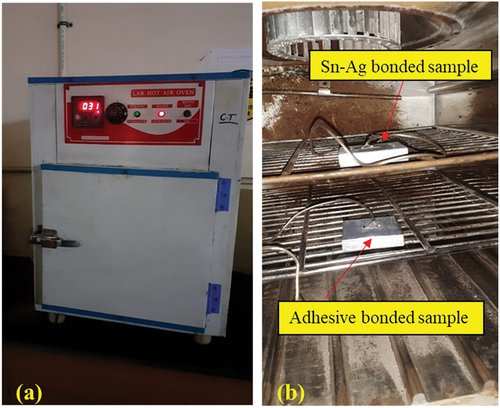
Figure 13. Chemical test by dropping chemicals. a) acid drop on epoxy bond b) alkali drop on epoxy bond c) acid drop on Sn-Ag-based al alloy bond d) alkali drop on Sn-Ag-based alloy bond.
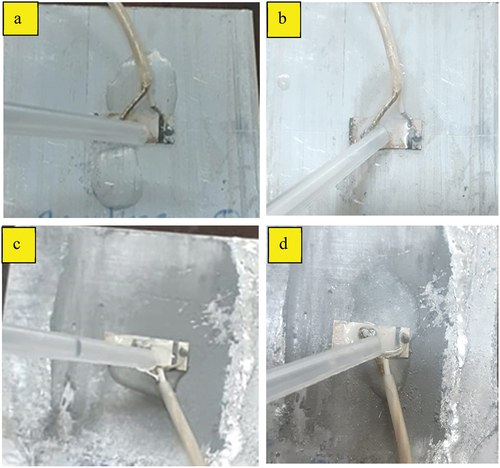
Figure 14. Degradation of the bond after exposure of 10 days. a) acid effects on the epoxy bond b) alkali effects on epoxy bond c) acid effects on Sn-Ag-based alloy bond d) alkali effects on Sn-Ag-based alloy bond.
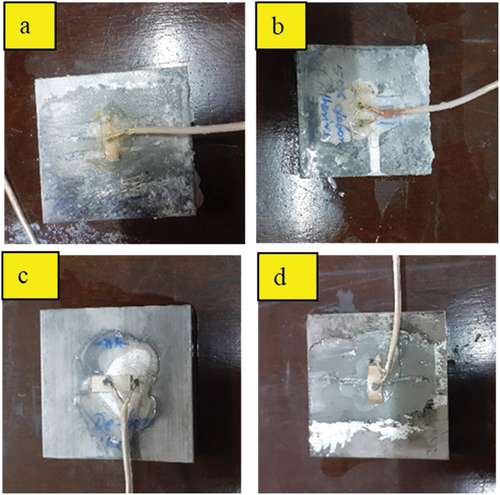
Figure 15. Comparison of the piezo coupled signature for free and bonded configurations. a) conductance vs. frequency. b) susceptance vs. frequency.
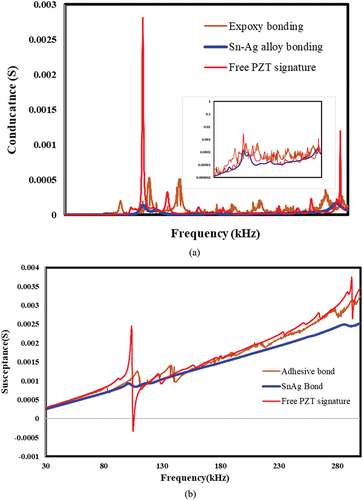
Figure 16. The effect of bonding and de-bonding on piezo coupled admittance signature for Sn-Ag alloy-based bonding. a) conductance vs frequency b) susceptance vs frequency.
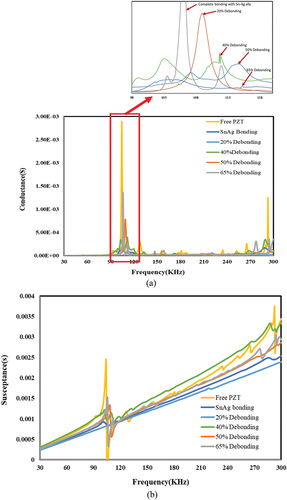
Figure 17. The effect of bonding and de-bonding on piezo coupled admittance signature for epoxy based bonding. a) conductance vs frequency b) susceptance vs frequency.
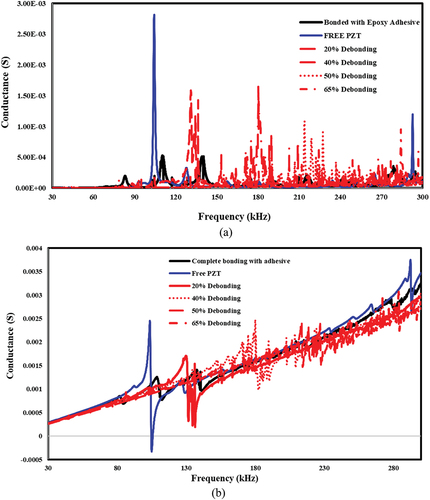
Figure 18. Effect of moisture exposure (constant im mersion) on the Sn-ag alloy-based bond. a) conductance vs. frequency b) susceptance vs. Frequency.

Table 3. Change in structural resonance frequency due to debonding.
Figure 19. Effect of moisture exposure (constant immersion) on epoxy-based bonding. a) conductance vs. frequency b) susceptance vs. Frequency.
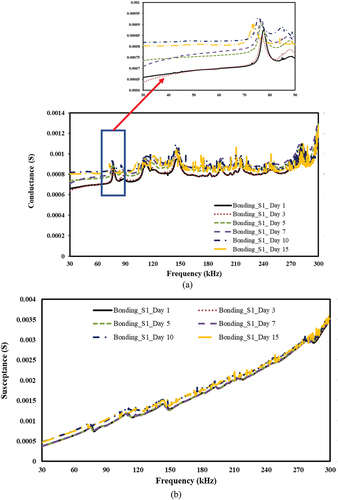
Figure 20. Effect of moisture ingression to bond area and corresponding piezo coupled admittance signatures for Sn-Ag alloy bond. a) conductance vs frequency b) susceptance vs frequency.
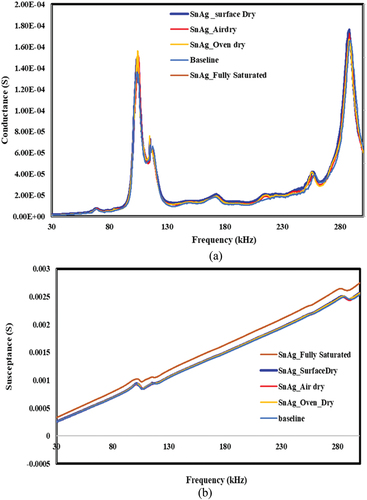
Figure 21. Effect of moisture ingress to bond area and corresponding piezo coupled admittance signatures for epoxy bond. a) conductance vs. frequency b) susceptance vs. Frequency.
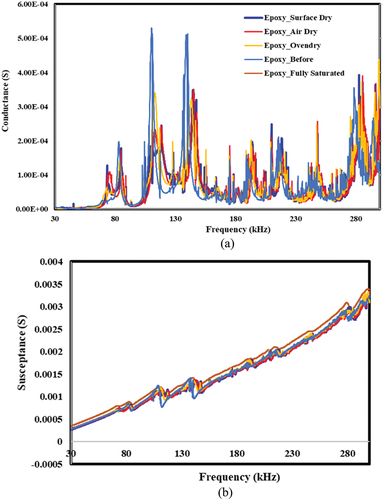
Figure 22. Effect of temperature for Sn-Ag-based alloy bond.
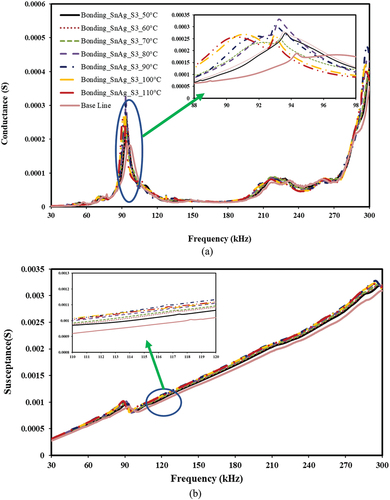
Figure 23. Effect of temperature for epoxy-based bond.
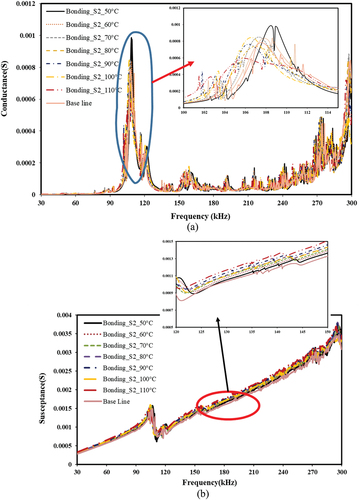
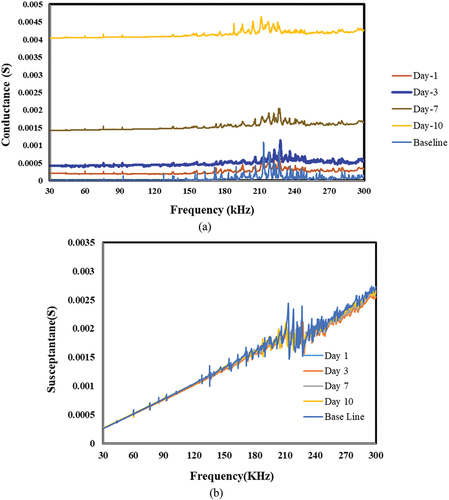
Figure 24. Effect of acid for Sn-Ag-based bond. a) conductance vs. frequency. b) susceptance vs. Frequency.
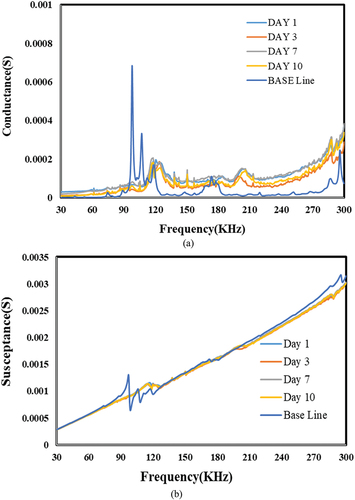
Figure 25. Effect of acid for epoxy-based bond. a) conductance vs. frequency. b) susceptance vs. Frequency.
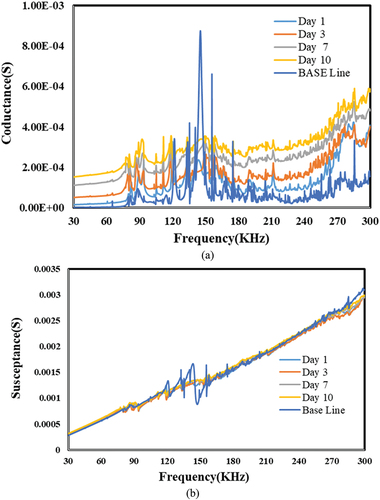
Figure 26. Effect of alkali for Sn-Ag based bond. a) conductance vs. frequency. b) susceptance vs. Frequency.
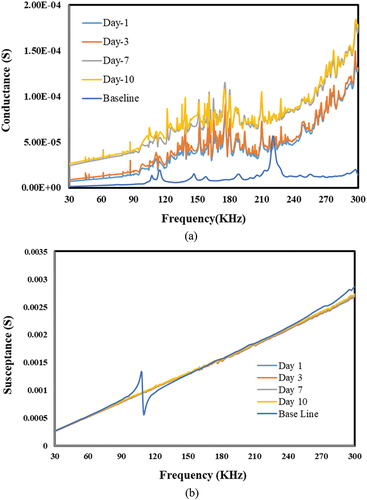
Figure 27. Effect of alkali for epoxy-based bond. a) conductance vs. frequency. b) susceptance vs. Frequency.
Data availability statement
The data sets generated during and/or analysed during the current study are available from the corresponding author on reasonable request.