
Figures & data
Figure 1. Diagram of area affected by failure of component column.
Figure 2. In , Point a represents the structural strain energy when the middle beam of the structure reaches the yield state after the failure of member i, and point B represents the structural strain energy when the middle beam of the structure fails after the failure of member i.
Figure 3. Diagram of beam affected by column failure.
Figure 4. Model size and beam and column number.
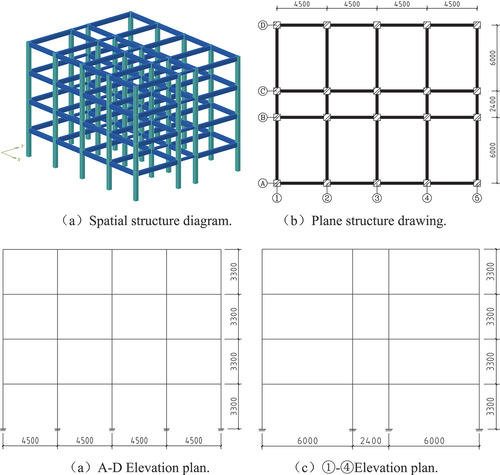
Figure 5. Change diagram of base reaction analyzed by Pushover.
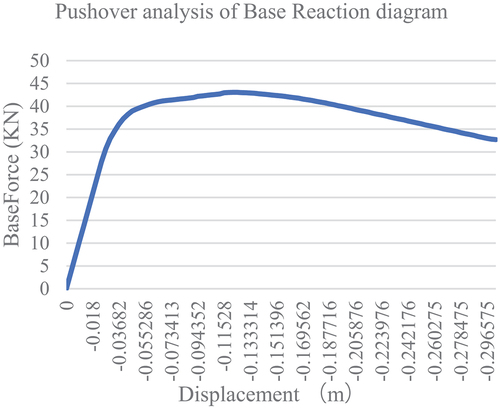
Figure 6. Schematic diagram of beam hinge results in the structure.
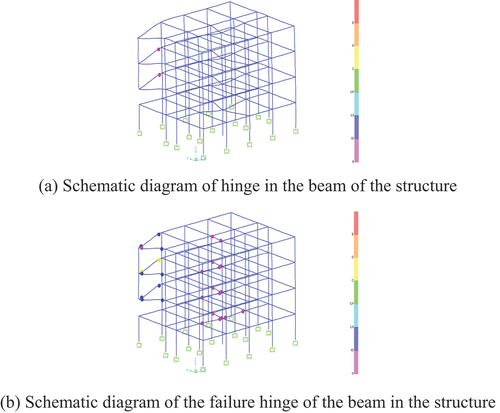
Table 1. Component importance factor.
Table 2. Structural vulnerability coefficient after removing one layer of column.
Table 3. Structural vulnerability.
Table 4. Robustness index.
Table 5. Removal of 1B–3 affects beam redundancy.
Table 6. Removal of 2B–3 affects beam redundancy.
Table 7. Removal of 3B–3 affects beam redundancy.
Table 8. Removal of 1C–1 affects beam redundancy.
Table 9. Removal of 1A–4 affects beam redundancy.
Table 10. Strengthen 1BC–3 beam redundancy and robustness index.
Table 11. Strengthen 2BC–3 beam redundancy and robustness index.