Figures & data
Table 1. Standards related to some earthen building materials published by SBs worldwide.
Figure 1. Location of the city of Auroville.
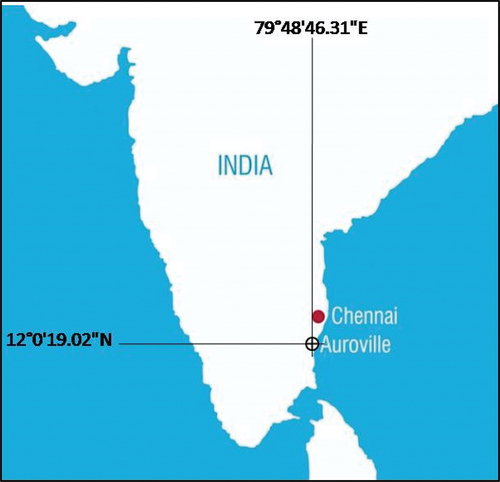
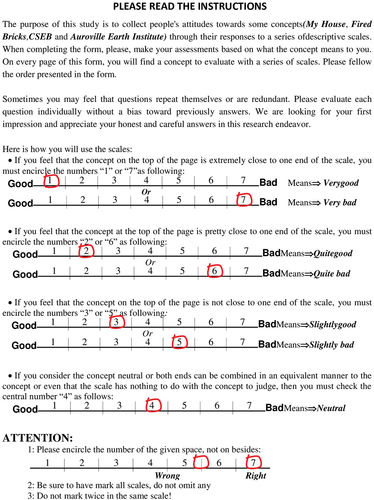
Table 2. The adjectival scales and their assigned theme titles in the order in which they appear on the questionnaire form.
Figure 2. The analysis steps and indicators used in the study. (a): indicators that concern the whole questionnaire or its subscales.
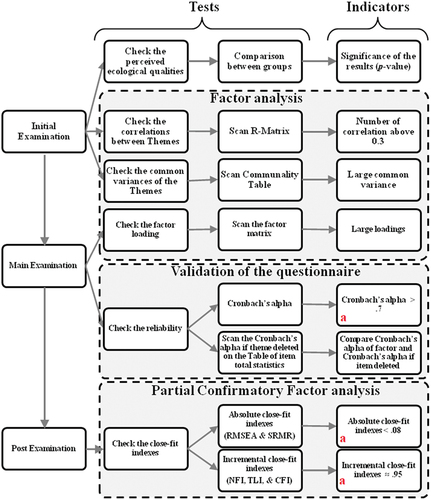
Table 3. Summary of MLE results for the attitude scale on CSEB (N = 302).
Table 4. Summary of MLE results for the attitude scale on fired-brick (N = 302).
Table 5. Summary of MLE results for the attitude scale on home (N = 302).
Table 6. Summary of MLE results for the questionnaire (N = 302).
Figure 3. The predominant building material in Auroville. This is based on participants’ statements. A chi square test was conducted for the difference in the proportion of houses’ type spread in Auroville χ2 (1, N = 272) = 150.01, p < .001, and a statistically significant difference is found.
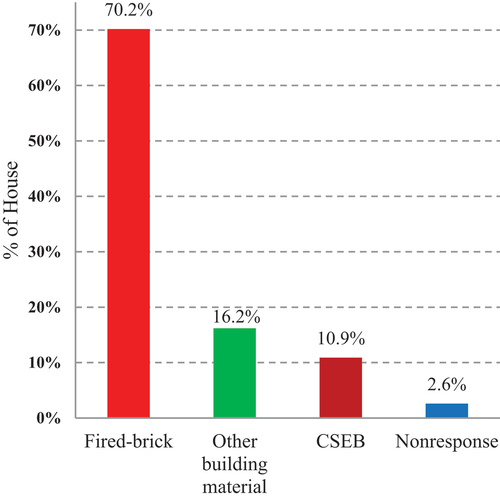
Figure 4. The predominant construction material according to the participant’s status in Auroville. Houses with CSEB are inhabited more by Aurovillians (24) than by natives (5) and volunteers (4). A chi square test was conducted for the difference in the number of inhabitants according to houses’ type and participant’ status in Auroville χ2 (4, N = 294) = 48.29, p < .001, and a statistically significant difference is found.
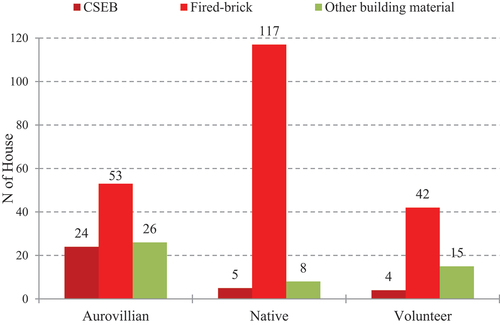
Figure 5. The ecological qualities of the studied three concepts; CSEB, houses, and fired-brick as perceived by Auroville population.
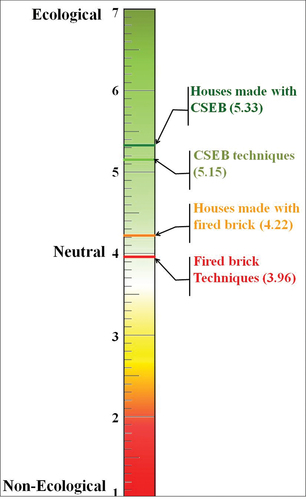
Figure 6. The ranking of the themes according to the number of correlation coefficient greater than 0.3 per theme. (a) MLE is conducted for each SD separately. (b) MLE is conducted for the questionnaire; the three SDs together. From (a) to (b) the number of correlations increases because some scales from one SD are correlated with others from other SDs of the questionnaire.
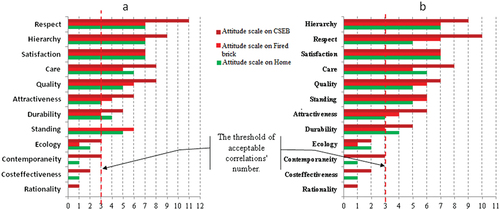
Figure 7. The ranking of the themes according to their values of correlation coefficients with the attitudes.
Figure 8. The scree plots. (a) the SD on fired brick. (b) the SD on homes (c) the SD on CSEB. Each plot is organized such that there is one factor for each theme. On the three SDs, the points of inflexion are located on the fourth factor. After the inflection points on each graph, where the abscissa is marked as four, the points align and closely approach the red dashed line. The number of factors to be retained is the number of points before the inflection point. There is some consistency between Kaiser’s criterion (3 factors on each of the ) and the scree plots that justify retaining 3 factors.
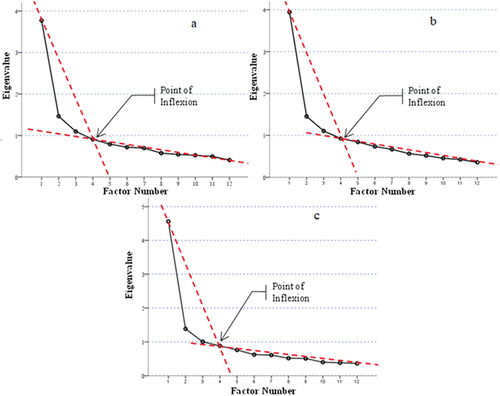
Figure 9. Comparison of the factor loadings. The loads of theme of Ecology are around 0.3. The differences observed in loads are significant only for the themes of Cost-effectiveness, Care, Durability, and Rationality. We can say that the theme of Cost-effectiveness is more important for the attitude toward CSEB than for the attitude toward fired brick (p < 0.001) and the attitude toward home (p < 0.001). The theme of Care is more important for attitude toward CSEB and attitude toward home than for attitude toward fired brick (p < 0.001). The theme of Durability is more important for attitude toward CSEB than for attitude toward fired brick (p < 0.05). Finally the theme of Rationality is more important for the attitude toward CSEB than for attitude toward home (p < 0.05).
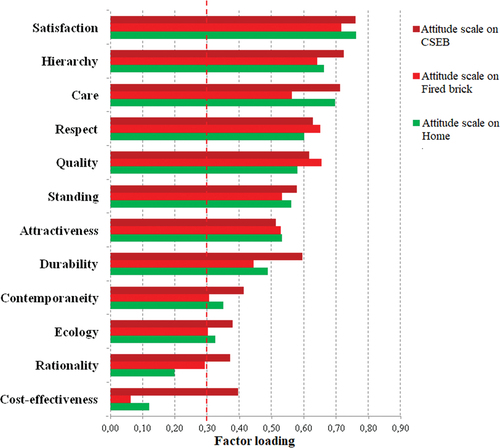
Figure 10. Comparison between the correlation coefficients of Ecology subscales with the 2 other subscales for the three attitudinal scales. .3 is the threshold of small coefficients.
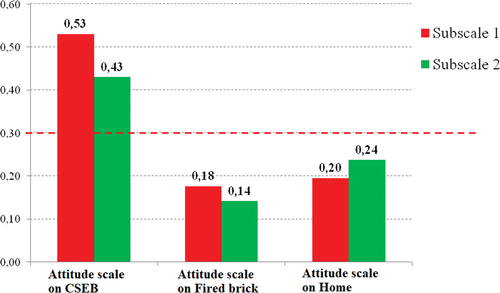
Figure 11. Comparison between the results of reliability test. Three subscales have Cronbach’s alpha above the threshold of 0.7.
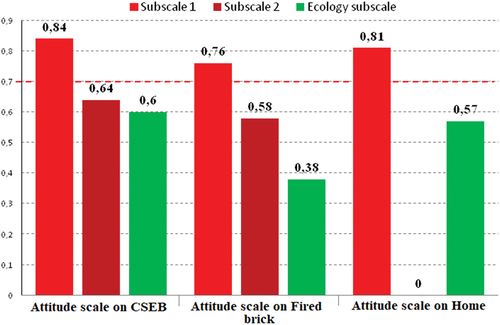
Figure 12. The absolute close-fit indexes values, the root mean square error of approximation (RMSEA) and the standardized root mean residual (SRMR), of the 3 scales. They all are below the threshold of .08. This indicates acceptable level of model fit.
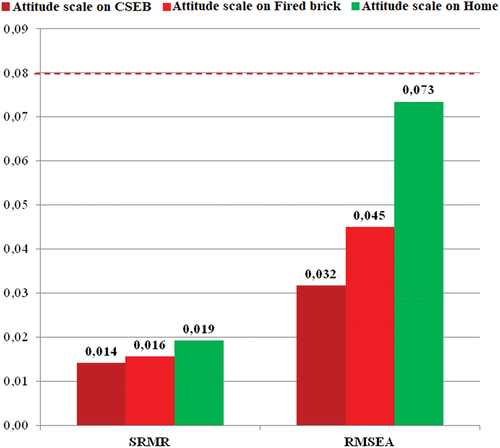
Figure 13. The 3 incremental close-fit indexes are the normed fit index (NFI), the Tucker–Lewis index (TLI) and the comparative fit index (CFI), of the 3 scales. They all are approximating and above the threshold of .95. This indicates acceptable level of model fit.
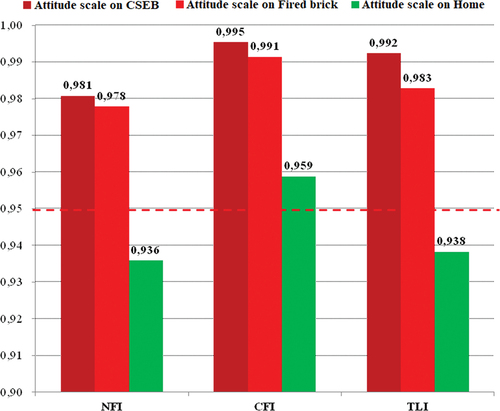
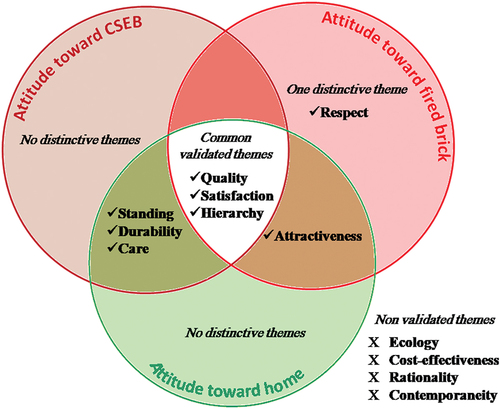
Figure 14. The themes selected for the 3 attitudinal scales. These common 3 themes are highly correlated with each other and give Cronbach's alphas > .7. They are .77, .73, and .70 for the attitudinal subscales on CSEB, on fired brick, and on home respectively. The 3 themes provide the foundation for the comparison of the three attitudes.