Figures & data
Table 1. Physical and chemical properties of isocyanate.
Table 2. Physical and chemical properties of combined polyether polyol.
Table 3. Physical and mechanical properties of cement.
Table 4. Physical and mechanical properties of granite aggregate.
Table 5. Polyurethane concrete mixture (by mass).
Table 6. Physical and mechanical properties of polyurethane concrete.
Table 7. Test plan for steel fiber polyurethane concrete.
Figure 1. Diagram of polyurethane concrete preparation.
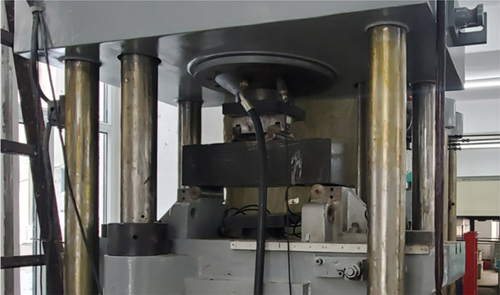
Figure 2. Definitions of flexural toughness parameters.
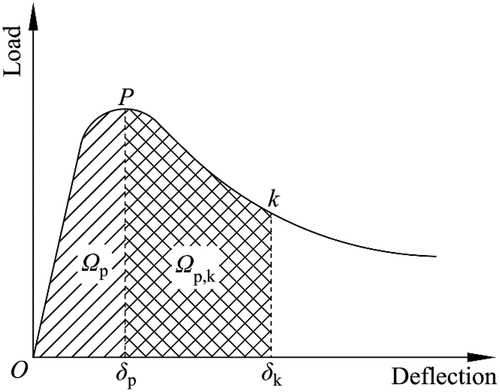
Figure 3. Test results of compressive strength of steel fiber polyurethane concrete.
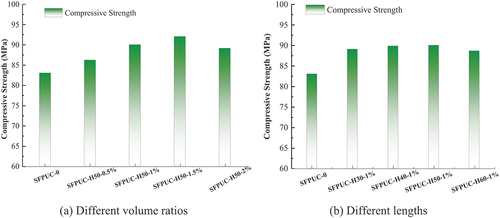
Figure 4. The typical cross-sectional distribution of steel fibers.
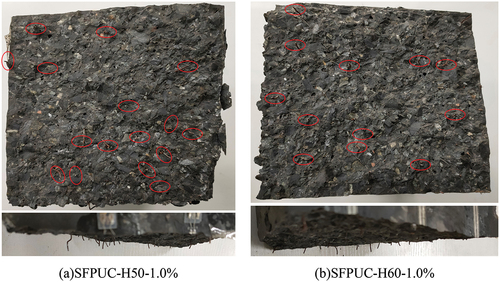
Table 8. The bending test results of the test beam.
Figure 5. Peak load and deflection of peak load.
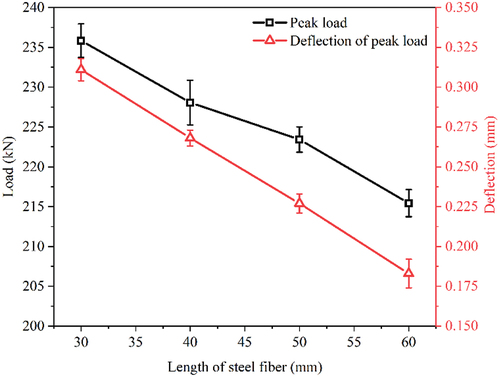
Figure 6. Typical load-deflection curves for polyurethane concrete beam specimens incorporating 1.0% of various fiber lengths.
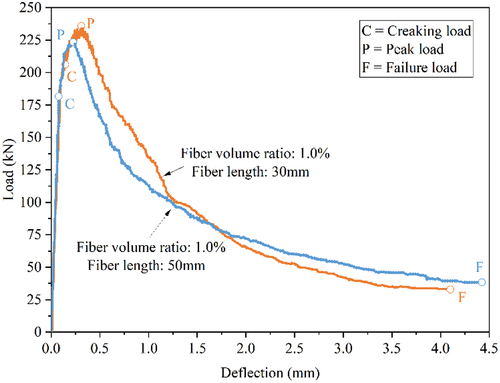
Figure 7. Peak load and deflection of peak load.
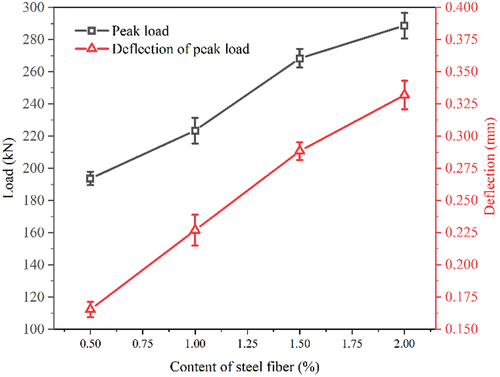
Figure 8. Typical load-deflection curves for polyurethane concrete beam specimens of various fiber content.
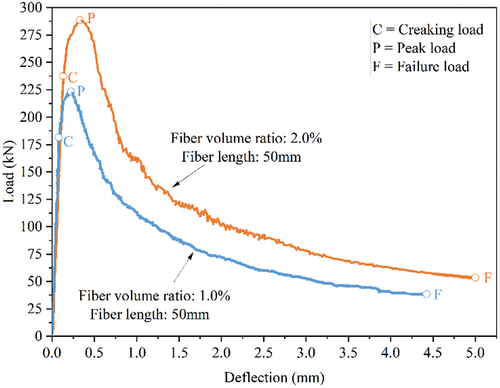
Figure 9. Microstructure of failure form of steel fiber in matrix (a: steel fiber pull-out, b: steel fiber fracture, c: end bonding failure of steel fiber).
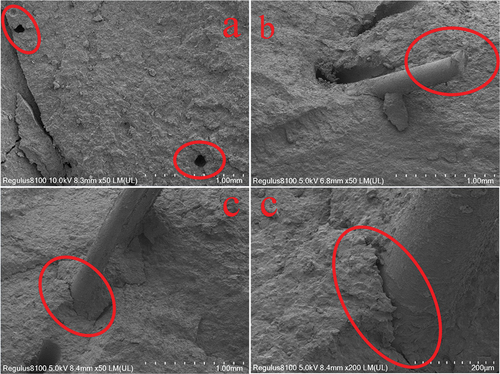
Figure 10. Flexural toughness ratio for polyurethane concrete beam specimens incorporating 1.0% of various fiber lengths.
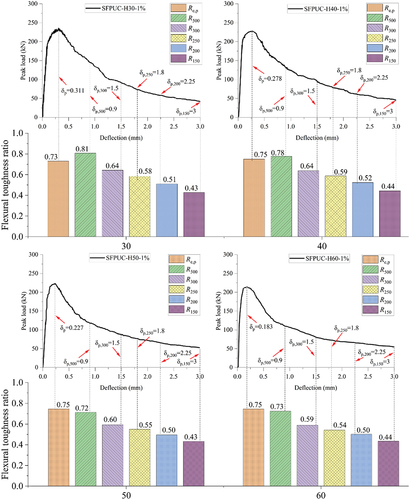
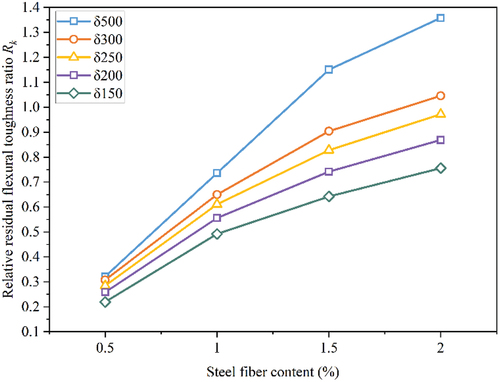
Figure 11. Flexural toughness ratio for polyurethane concrete beam specimens with different content of steel fiber.
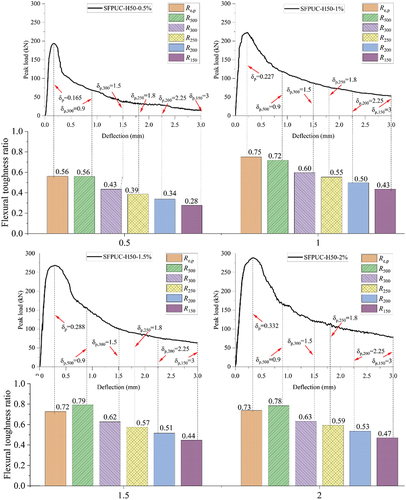
Table 9. Flexural toughness index variability of polyurethane concrete with different steel fiber lengths.
Table 10. The area Ω150 enclosed by the load-deflection curve and the coordinate axis at characteristic deflection δ150.
Figure 12. Definitions of flexural toughness parameters.
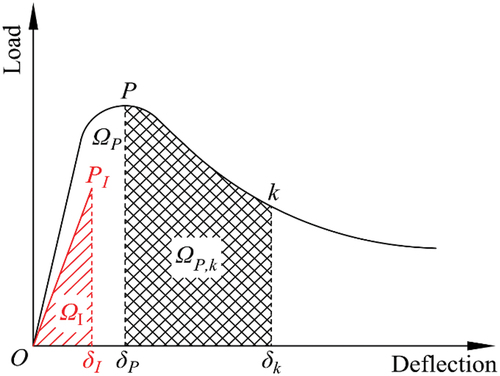
Figure 13. Toughening degree DI and relative initial flexural toughness ratio RP of polyurethane concrete with different steel fiber length.
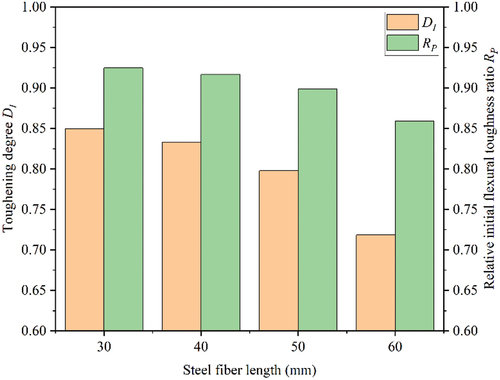
Figure 14. Relative residual flexural toughness ratio Rk of polyurethane concrete with different steel fiber length.
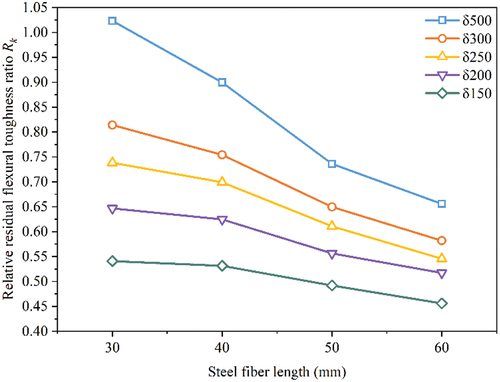
Figure 15. Toughening degree DI and relative initial flexural toughness ratio RP of polyurethane concrete with different steel fiber content.
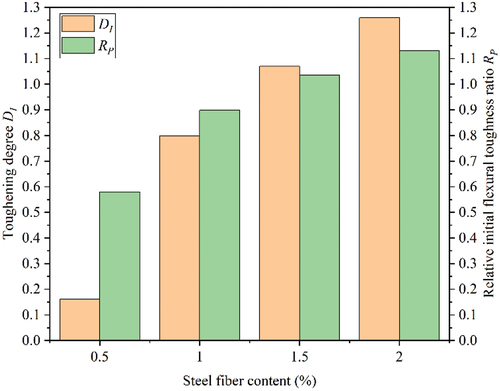
Figure 16. Relative residual flexural toughness ratio Rk of polyurethane concrete with different steel fiber content.