
Figures & data
Figure 1. Research flow diagram.
Figure 2. Signboard examples in unregulated areas.
(All images used in this study were taken by authors between 2021 and 2023)
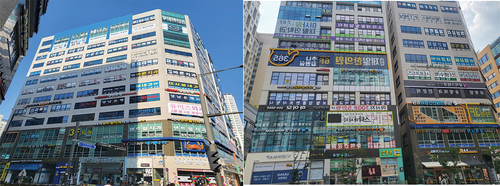
Figure 3. Layout of selected commercial buildings and the surrounding environment.
(Source of satellite view map: https://map.naver.com/)
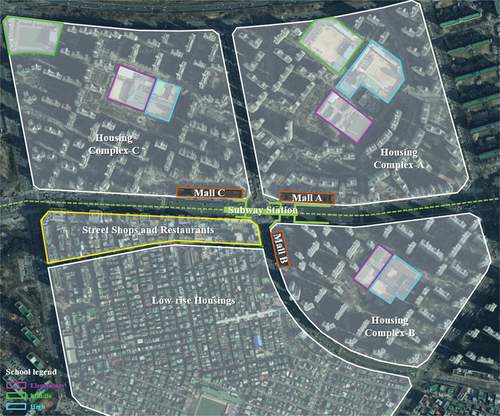
Table 1. Description and characteristics of each mall.
Figure 4. Street view of building a.
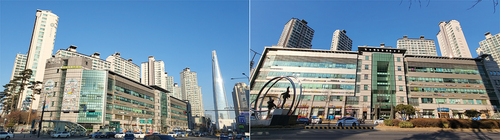
Figure 5. Street views of buildings b and c.
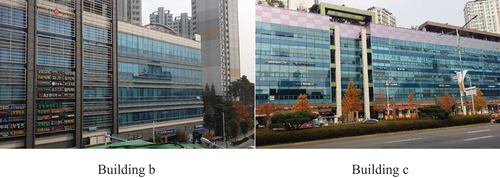
Table 2. Pre- and post-signboard regulation: the reduction of signboard areas.
Figure 6. Comparison of cost components (LED vs. RFG signboard).
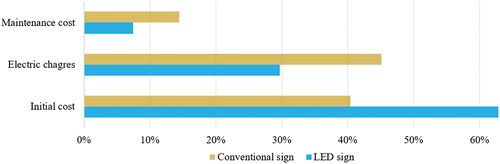
Figure 7. Questionnaire survey form structure.
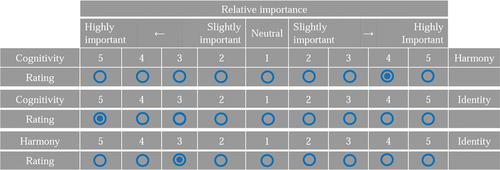
Table 3. Customer response distribution.
Table 4. Customers’ perceptions.
Table 5. Business owners’ perceptions.