
Figures & data
Table 1. Chemical composition of the OPC used in this study.
Figure 1. Compressive strength and density results at various SAPs contents.
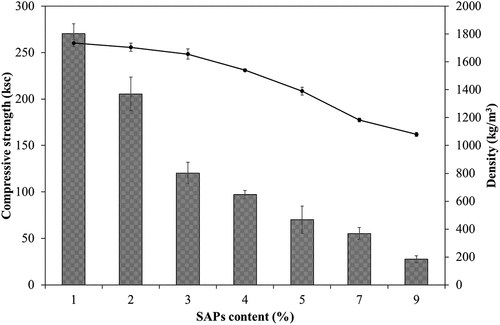
Table 2. Mix proportions per m3 for the samples in this study.
Figure 2. Experimental set up of (a) the flexural strength measurement, (b) schematic diagram.
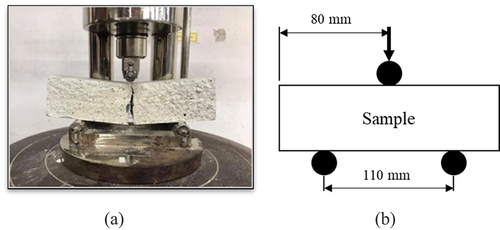
Figure 3. Schematic measurements of sorptivity.
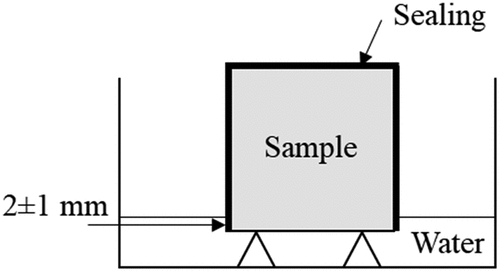
Figure 4. Compressive strength of the lightweight concretes prepared using SAPs and GF.
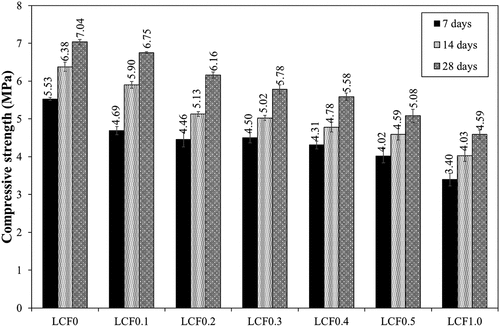
Figure 5. Flexural strength of lightweight concrete prepared using SAPs and GF. (a) flexural strength, (b) deflection in 28-day samples.
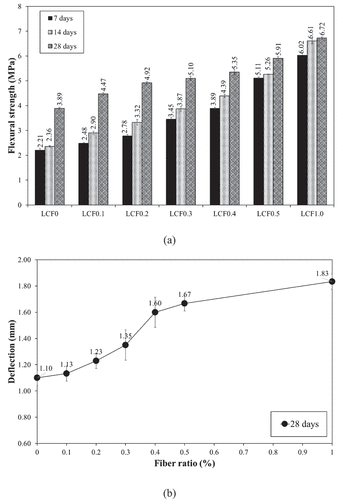
Figure 6. Dry density and porosity of lightweight concrete containing SAPs and GF.
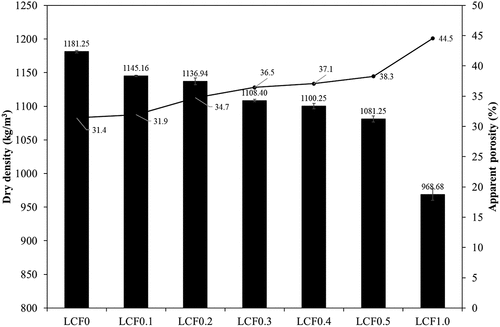
Figure 7. Thermal conductivity of lightweight concrete prepared using SAPs and GF.
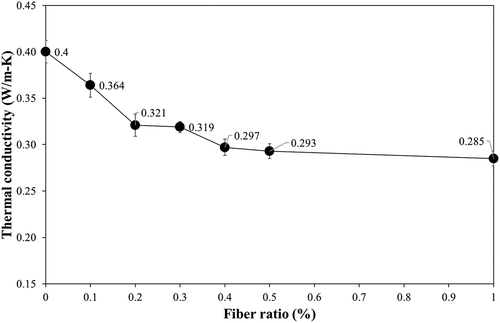
Figure 8. Water absorption curves of lightweight concrete prepared using SAPs and GF.
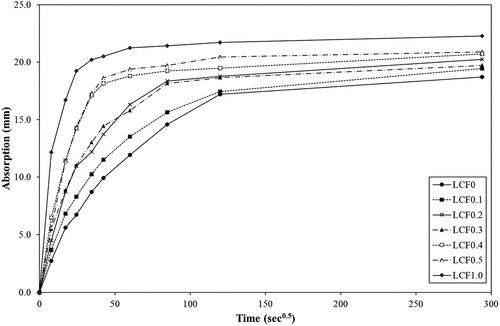
Table 3. Initial rate of water absorption at t = 35 sec0.5 of lightweight concrete prepared using SAPs and GF.
Figure 9. SEM micrographs. (a) LCF0 at 1000X magnification, (b) and (c) mixture with GF at 30 and 1000X magnification, respectively.
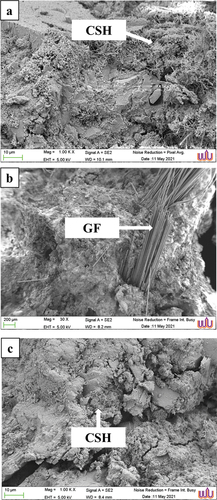
Table 4. Comparison of results obtained in this study with literature.