Figures & data
Figure 1. Drawing of tensile test apparatus.
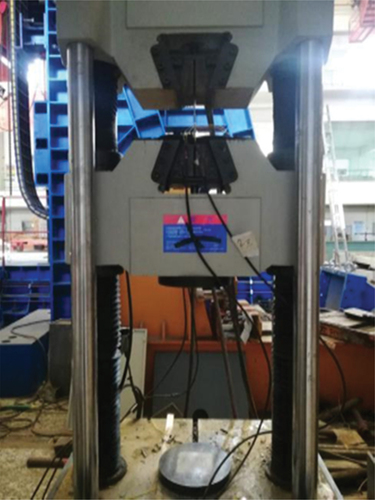
Table 1. Performance of steel.
Figure 2. Photographs of regenerated macroaggregate with various particle sizes.
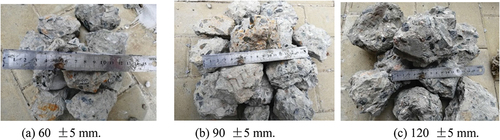
Figure 3. Regenerated aggregate in immersion.
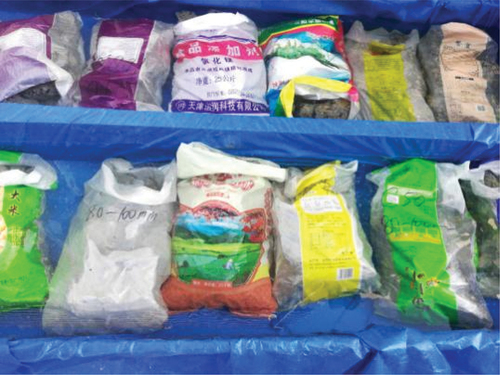
Table 2. The measured and calculated compressive strength of self-compacting concrete (SCC) cubes with reclaimed large aggregate.
Table 3. Specimen parameters.
Figure 4. Fabrication of components.
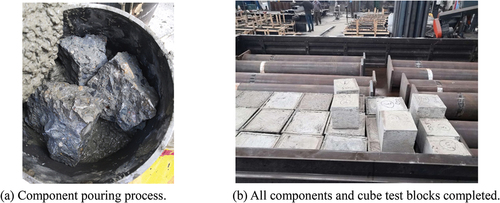
Figure 5. Test loading device.
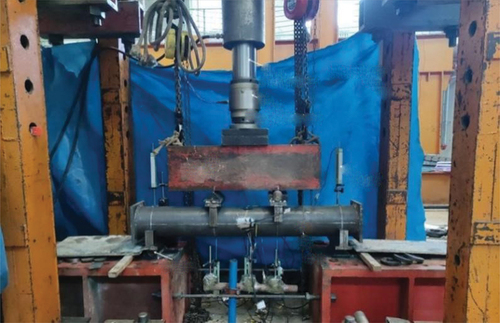
Figure 6. The load bearing setup.
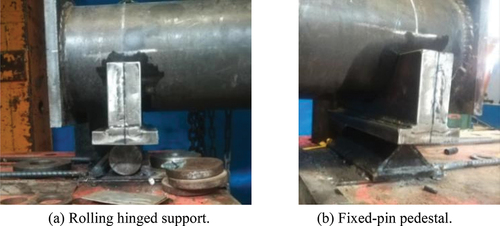
Figure 7. The measuring device layout of the specimen.
Figure 8. Failure modes of the specimens.
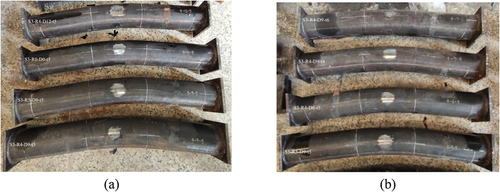
Figure 9. Failure conditions within the specimen.
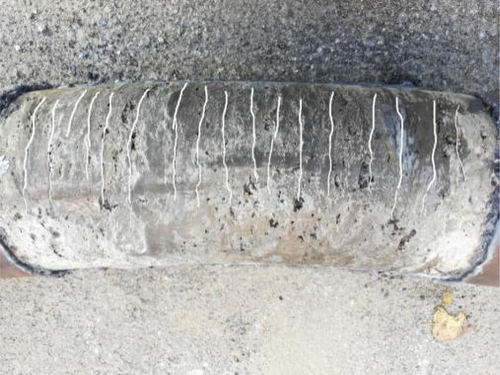
Figure 10. The influence of the steel tube wall thickness on the bending moment-midspan deflection curve of the component.
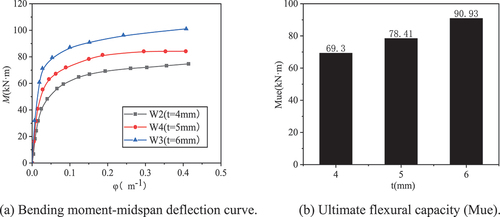
Figure 11. The influence of the RLA strength on the bending moment-midspan deflection curve of the component.
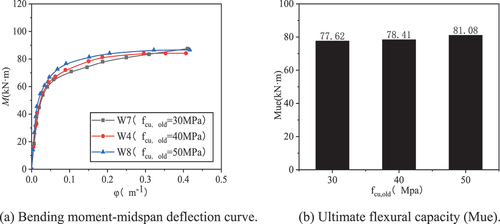
Figure 12. Effect of the RLA particle size on the bending moment-midspan deflection curve.
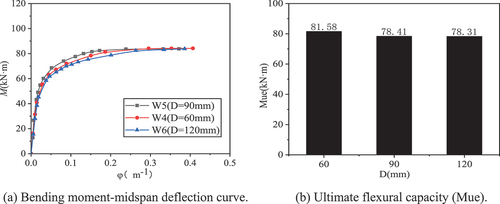
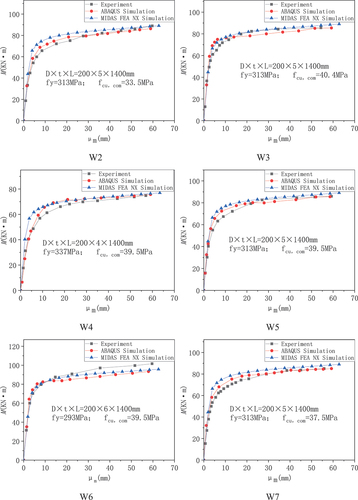
Figure 13. Contrast of bending moment–midspan deflection curves.
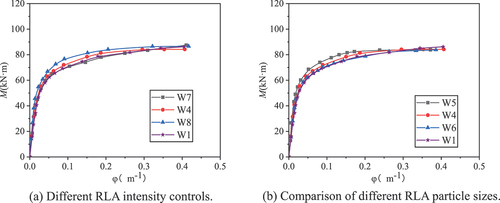
Table 4. Comparison of measured and calculated values of flexural capacity of members.
Figure 14. Stress-strain curve of low carbon steel.
Figure 15. Grid division of each component.
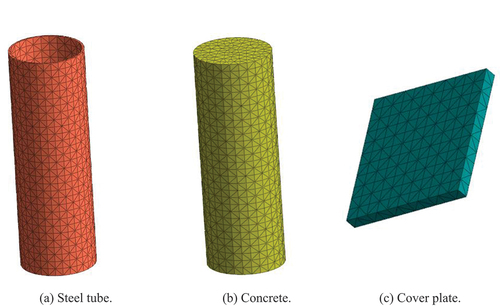
Figure 16. The boundary conditions of the model.
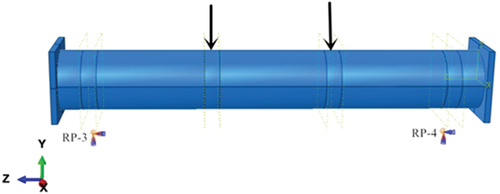
Figure 17. Comparison of the moment-midspan displacement (M‒ curves.