
Figures & data
Figure 1. Location map of the Nanshiku Temple in Pingliang, Gansu, China.
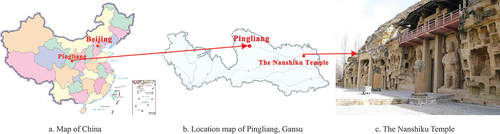
Table 1. Analysis of rock minerals and their contents (%)
Figure 2. Example map of the weathered state of the Nanshiku Temple, Gansu, China.
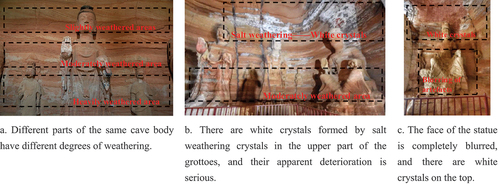
Figure 3. Diagram of freeze-thaw cycle temperature variation.
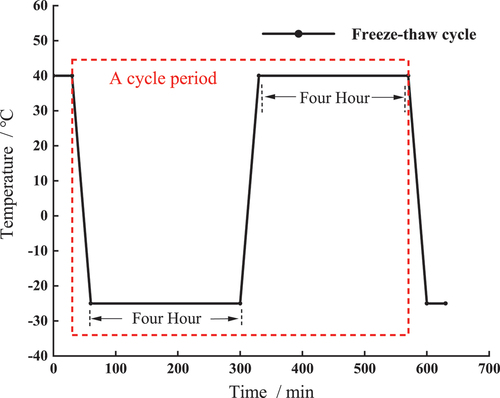
Table 2. Table of group of stone samples.
Table 3. Indicators of sandstone with different weathering degrees.
Figure 4. Surface degradation characteristics of stone samples under salt weathering.
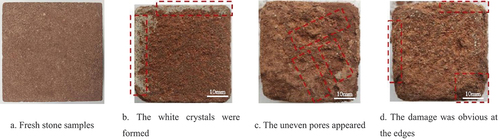
Figure 5. Macroscopic characteristics of salt weathering cycles of stone samples with different weathering degrees after fifteen times.
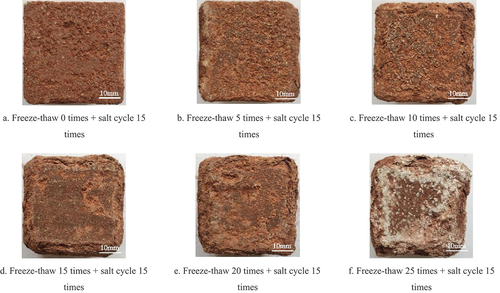
Figure 6. Microscopic morphology of stone samples under salt weathering.
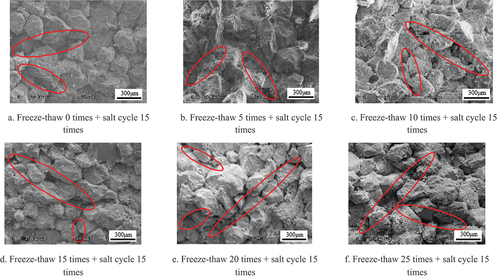
Figure 7. Mass change rate curve of sample during salt weathering.
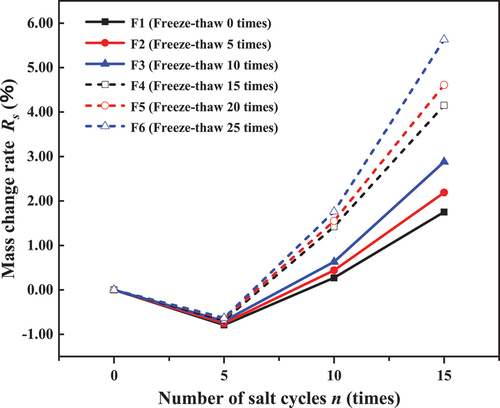
Figure 8. The measured and fitting curves of wave velocity during salt weathering.
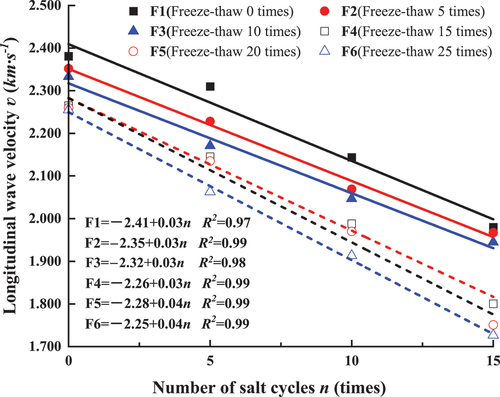
Table 4. Variation in wave velocity values of rock samples with different degrees of weathering under salt weathering.
Figure 9. Surface hardness curves of samples during salt weathering.
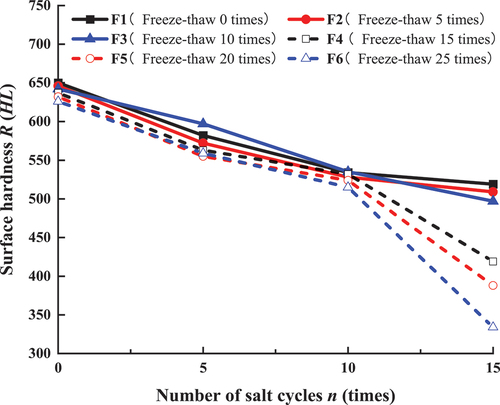
Figure 10. Surface hardness measured and deterioration model curves.
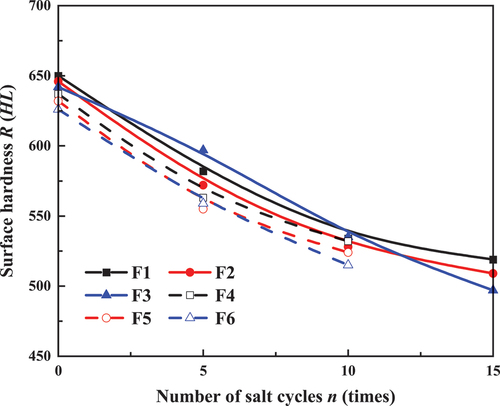
Figure 11. Failure characteristics of F1~F6 samples under uniaxial compression after salt weathering.
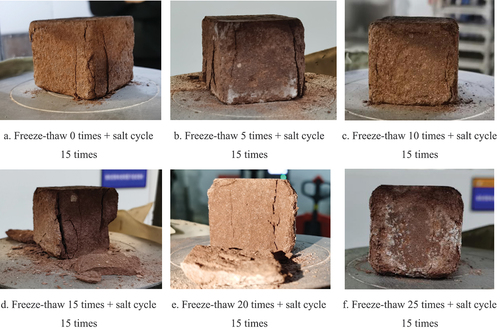
Figure 12. UCS curve of sandstone under different weathering.
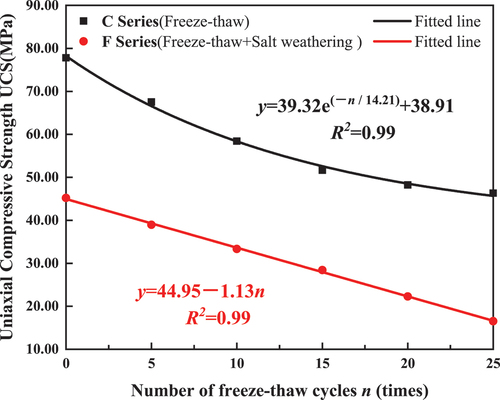
Figure 13. Curves for the rate of loss of UCS of stones before and after salt weathering.
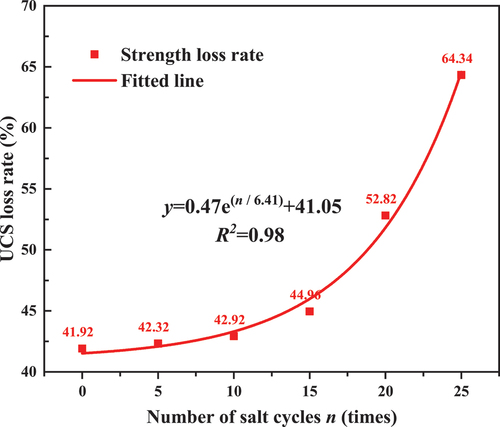
Figure 14. The curves of UCS and wave velocity were compared during the experiment.
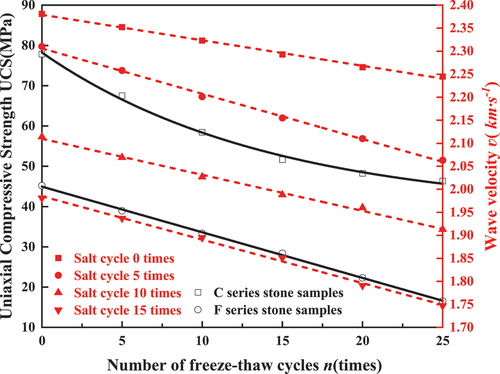
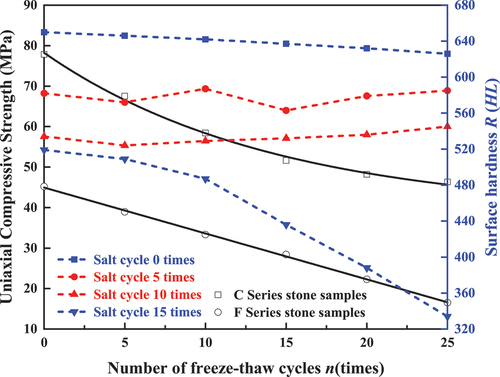
Figure 15. The curves of UCS and surface hardness were compared during the experiment.
Data availability statement
Data Sharing is not applicable.