Figures & data
Figure 1. Location map of West Lake area in Hangzhou.
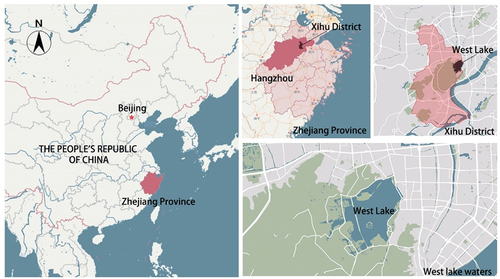
Figure 2. Distribution map of “Ten Scenes of West Lake” and measuring points.
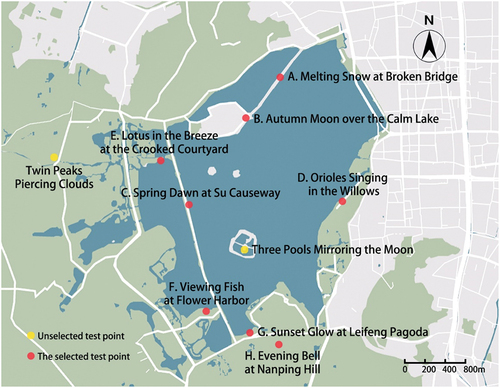
Table 1. Basic spatial characteristics of each measurement point.
Figure 3. Placement of meteorological station.
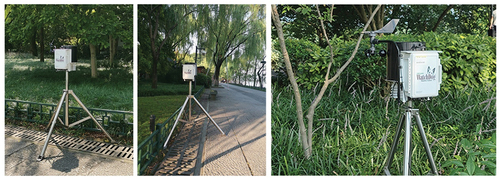
Table 2. Correspondence between PET evaluation and thermal comfort.
Figure 4. Mean air temperature at each measurement point.
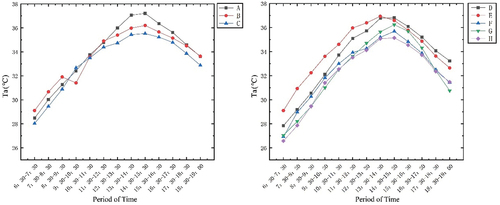
Figure 5. Mean relative humidity of each measurement point.
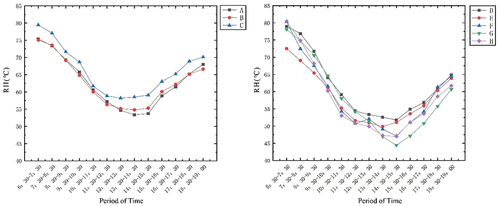
Figure 6. Mean wind speed of each measuring point.
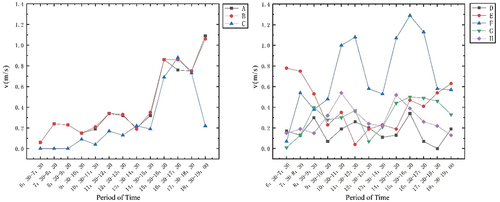
Figure 7. Thermal sensation vote (TSV) results at different measurement points.
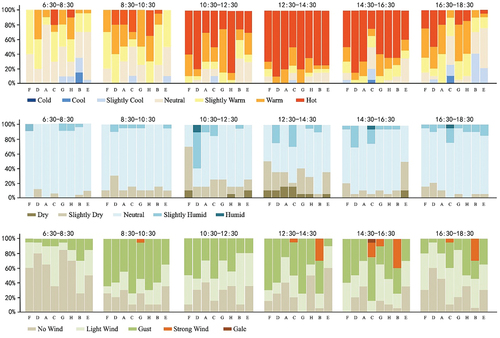
Figure 8. Mean PET values of each measurement point.
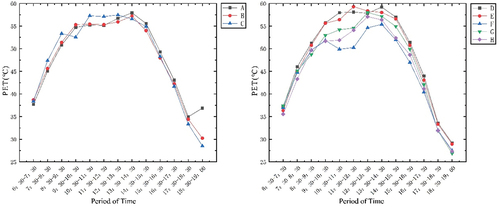
Table 3. Distribution of thermal comfort.
Table 4. Average PET values of each measurement point.
Table 5. Ranking of PET Mean values at different measurement points during various time periods.
Figure 9. PET average values at each measurement point.
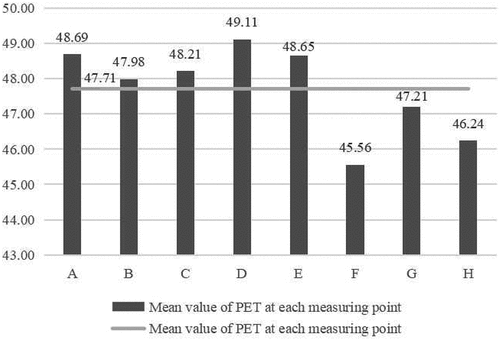
Figure 10. PET standard deviation at each measurement point.
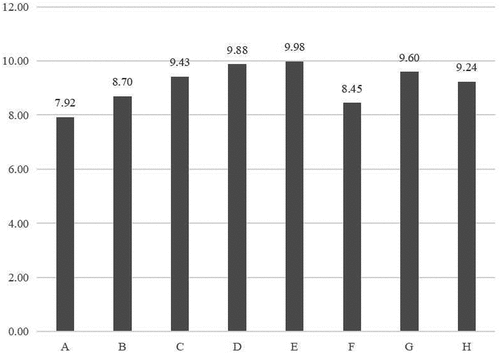
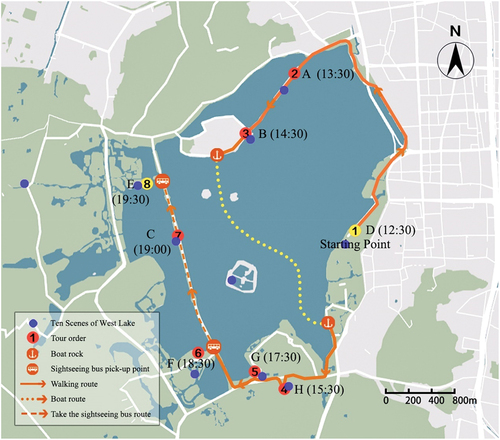
Figure 11. Tour route plans.
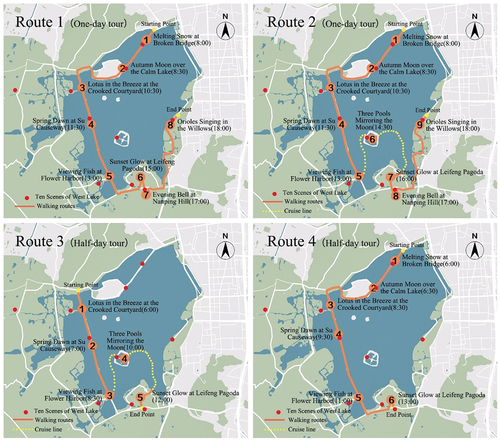
Table 6. Each section planning standard quantification table.
Figure 12. Optimized design route 1.
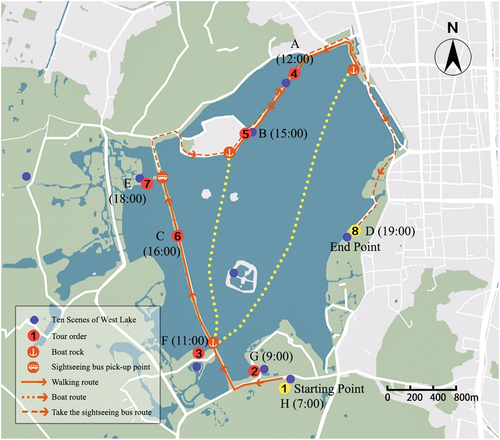
Figure 13. Optimized design route 2.