Figures & data
Figure 1. Joint structure in the 2008 edition of the Ministry of Transport general drawings (mm).
Figure 2. Diagram of the test piece reinforcement design and wet joint size (mm).
Figure 3. Fabrication process of the specimens.
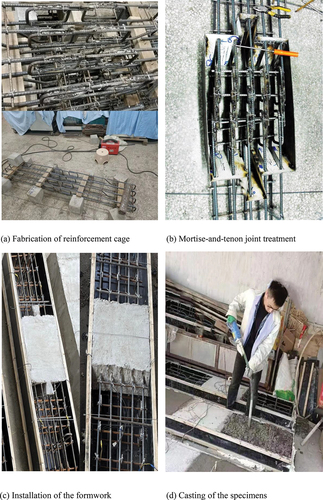
Figure 4. Loading design and device.
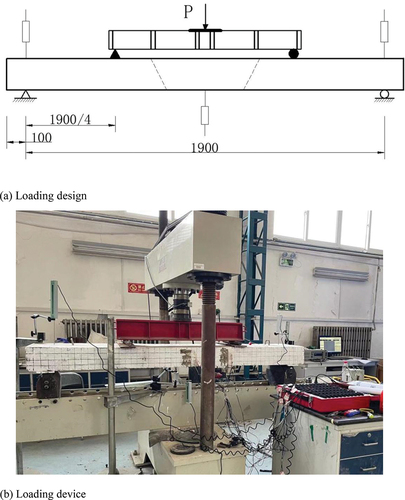
Figure 5. Normal section damage due to the flexure of the specimens.
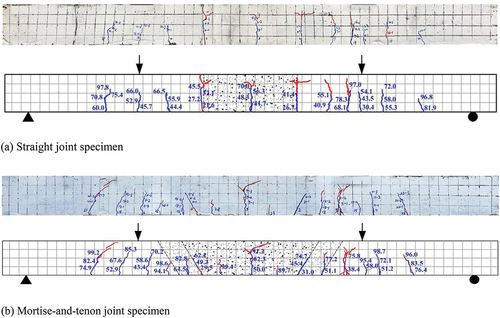
Figure 6. Load – displacement curve for the flexural damage test.
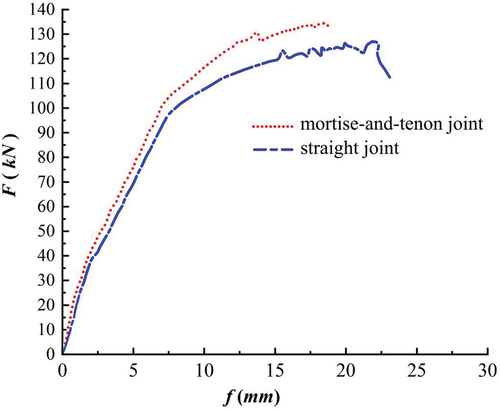
Table 1. Cracking load, yield load, peak load, and deflection of the specimen.
Figure 7. Concrete constitutive relationship curve.
Table 2. Plasticity parameter values of concrete.
Figure 8. Reinforcement constitutive relationship.
Figure 9. Finite element model.
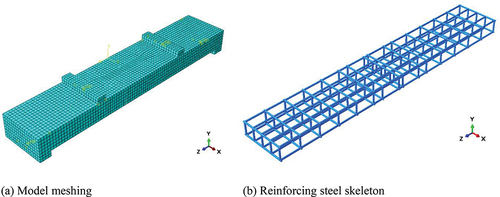
Figure 10. Comparison of load – displacement curves.
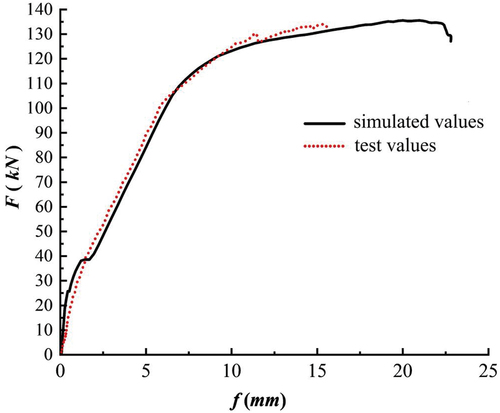
Table 3. Comparison of feature loads and corresponding deflections.
Figure 11. Comparison of tensile damage to the specimens.
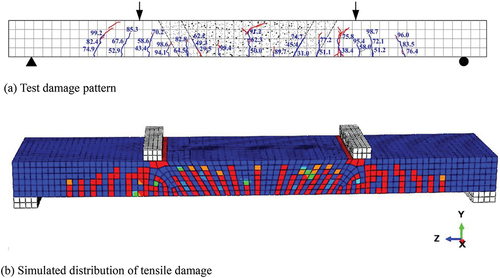
Figure 12. Tensile damage process on the bottom surface of a mortise-and-tenon joint.
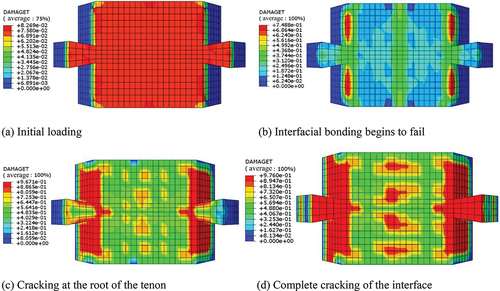
Figure 13. Tenon size design of finite element simulation (mm).
Figure 14. Load – displacement curves for specimens with different tenon sizes.
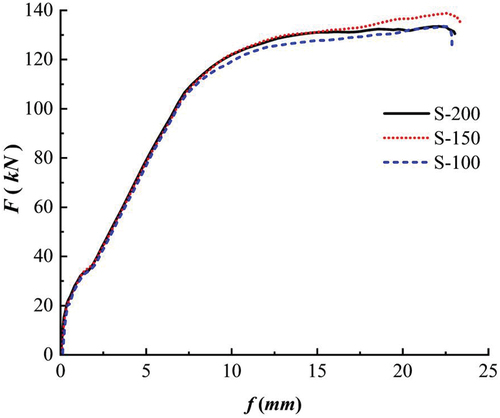
Figure 15. Tensile damage nephogram for tenons of different sizes at the same moment.
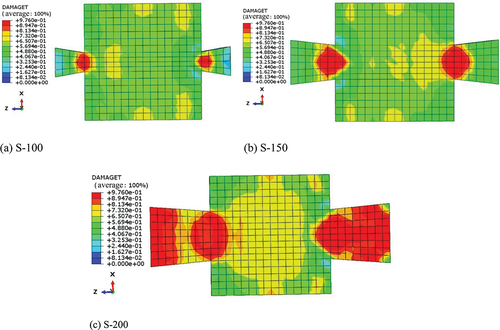
Figure 16. Calculation of flexural load bearing capacity of the normal section of the single reinforced rectangular section member.