
Figures & data
Figure 1. Workflow of this study.
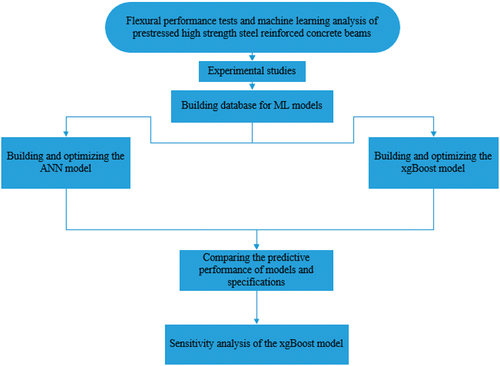
Table 1. Meanings of nouns.
Figure 2. Cross-sectional reinforcement diagram.
Table 2. Parameter of specimens.
Table 3. Mechanical properties of steel.
Figure 3. Test device and instrumentation.
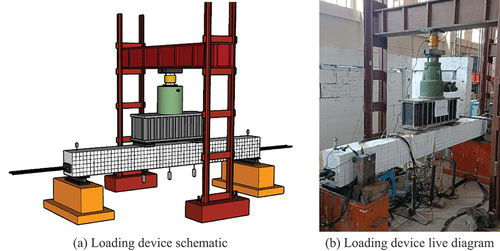
Figure 4. Arrangement of strain gauge and displacement meter.
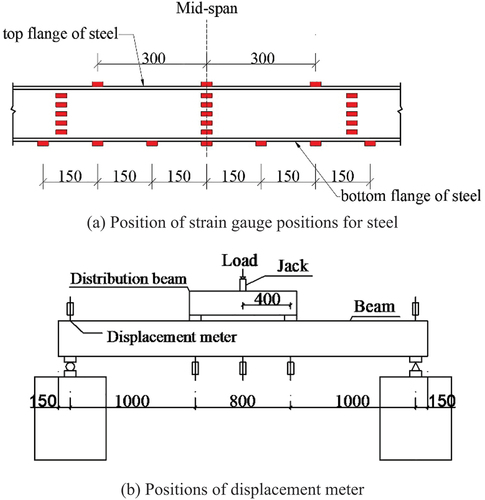
Figure 5. Damage pattern of some test beams.
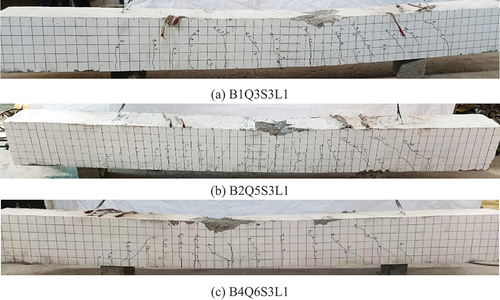
Table 4. Yield load, ultimate load of the test.
Figure 6. Load-deflection curves for different beams.
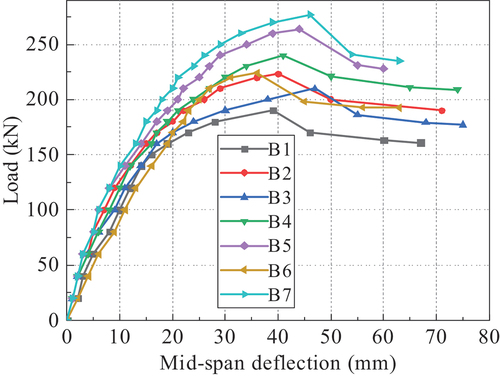
Figure 7. Strain distribution along the depth of the steels.
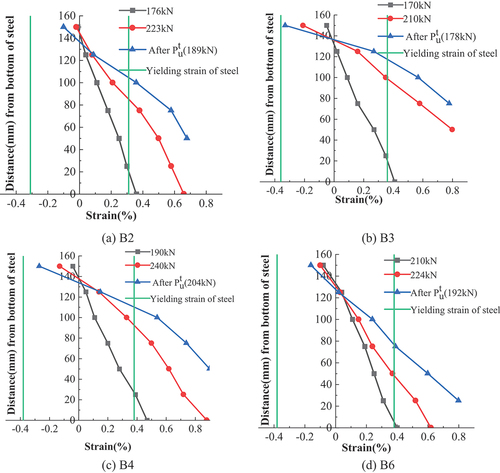
Figure 8. Strain distribution along the depth of the beams.
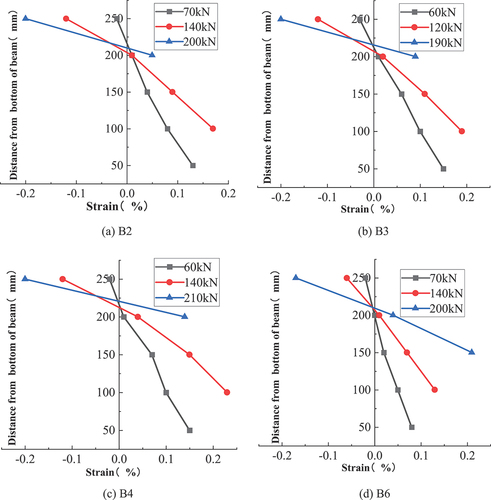
Figure 9. Architecture of the ANN model.
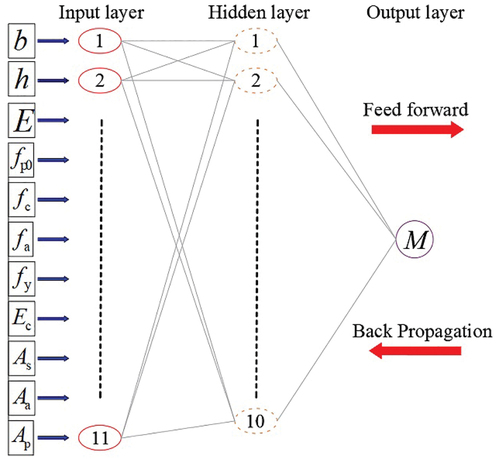
Figure 10. Performance of models with different numbers of neurons.
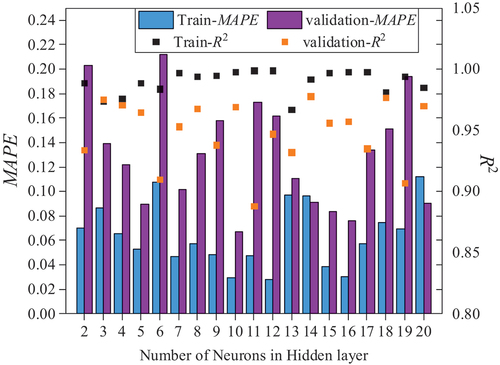
Table 5. Optimized values of the hyperparameters for the XGBoost model.
Figure 11. Stress distribution diagram of beam section of JGJ369–2016.
Figure 12. Comparison of the predicted and experimental values of the ANN model.
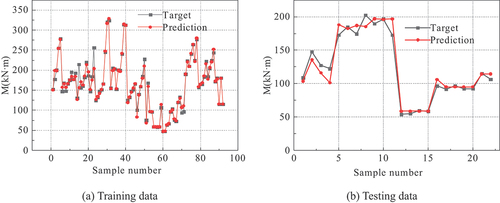
Figure 13. Comparison of the predicted and experimental values of the XGBoost model.
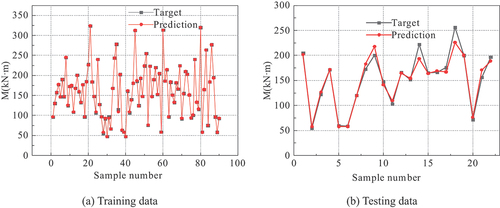
Figure 14. Comparison of models and codes.
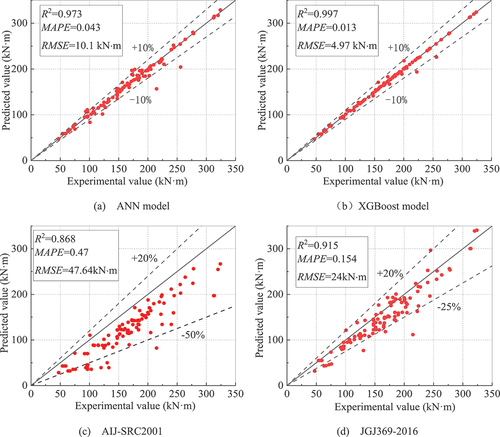
Figure 15. Shap values of input parameters, (a) each point (b) average value.
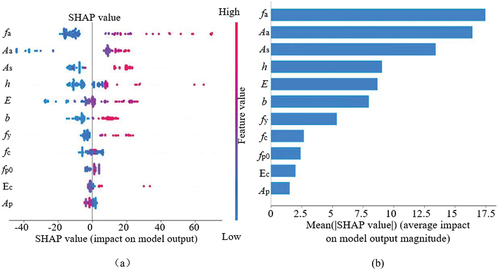
Figure 16. Interaction plot of factors.
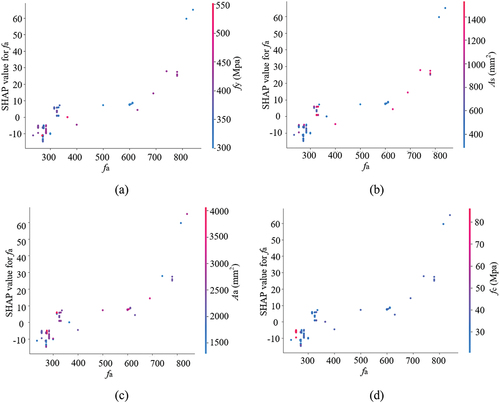
Table A1. Details of all specimens