
Figures & data
Figure 1. Types of fear of crime and major research areas.
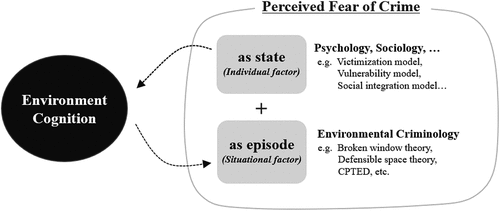
Figure 2. Concept of the research questions.
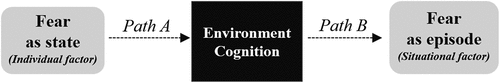
Table 1. Measurement of fear of crime (FOC) as an individual factor (Questionnaire 1).
Table 2. Measurement of situational fear of crime (Questionnaire 2).
Table 3. Criteria for selecting streets.
Table 4. Information on four selected streets.
Table 5. Images illustrating the experimental stimuli video (midpoint of the video).
Figure 3. Example image of videos with set AOIs.
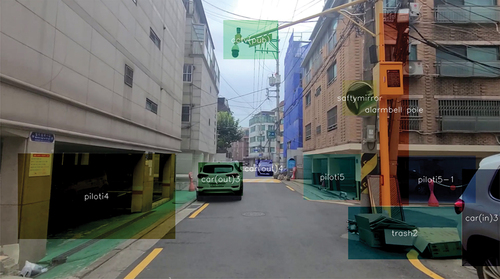
Figure 4. Visualized example of fixation data being recorded on the set AOIs.
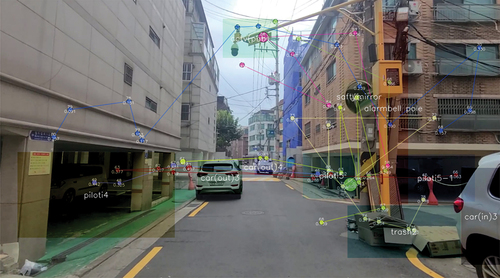
Table 6. Criteria for setting AOI.
Figure 5. Order of questionnaires and eye-tracking experiment.
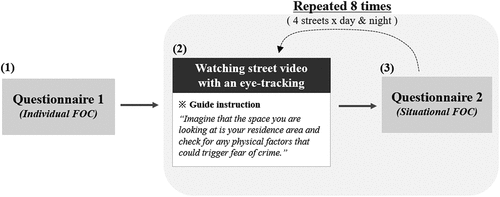
Figure 6. The layout of the experiment situation.
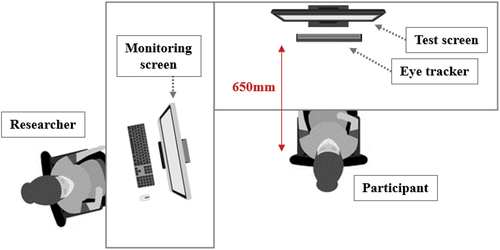
Table 7. Results of the questionnaire 1 (n = 29).
Table 8. Evaluation of the situational fear of crime felt on each street (Questionnaire 2; n = 29).
Table 9. Mean duration and frequency for each environmental factor (n = 29).
Table 10. Environmental factors affected by individual fear of crime during the day (n = 29).
Table 11. Environmental factors affected by individual fear of crime at night (n = 29).
Table 12. Environmental factors affecting situational fear of crime at night (n = 29).
Figure 7. Summary of the relationship between environment and fear of crime.
