
Figures & data
Figure 1. Spatial layouts of the nine case study public parks in Greater Cairo. For colour illustrations, please refer to the electronic version of the article.
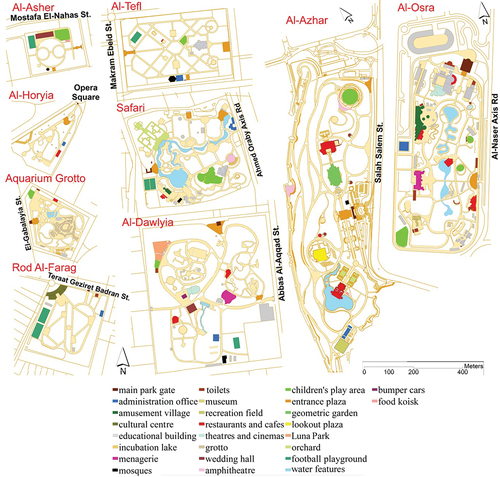
Figure 2. An example of a hypothetical park layout (a), permeability between spaces (b), and justified graphs for space 1 and space 5.
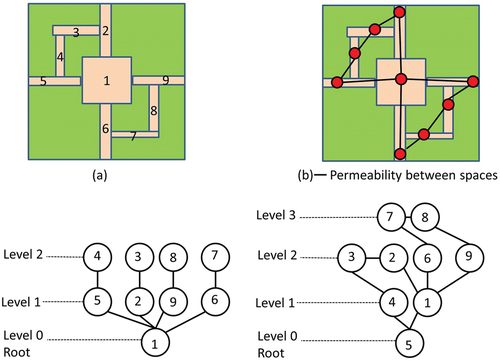
Figure 3. Justified permeability graphs for the nine parks drawn from the main entrance. For colour illustrations, please refer to the electronic version of the article.
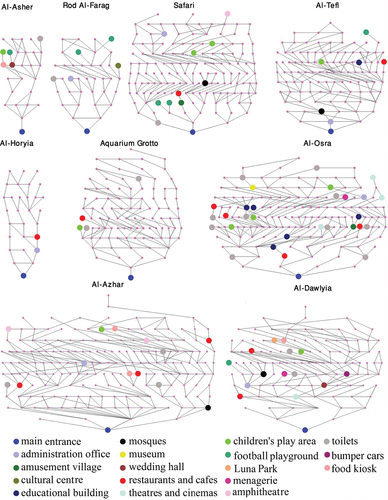
Figure 4. Global integration (a) and connectivity (b) for the nine parks. For colour illustrations, please refer to the electronic version of the article.
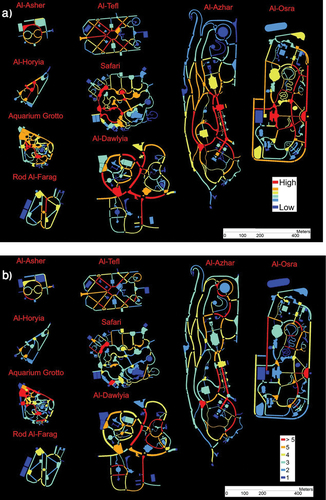
Figure 5. Control (a) and controllability (b) for the nine parks. For colour illustrations, please refer to the electronic version of the article.
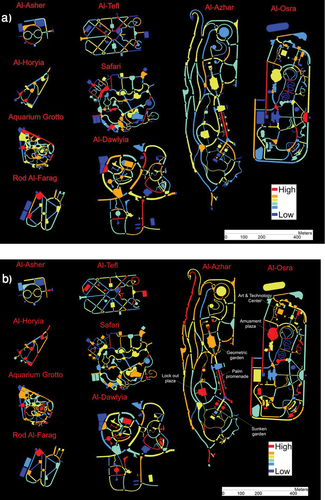
Figure 6. Relativised entropy for the nine parks. For colour illustrations, please refer to the electronic version of the article.
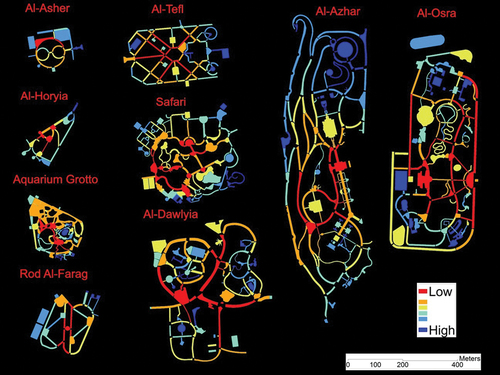
Figure 7. Boxplots of different syntactic attributes for the nine parks.
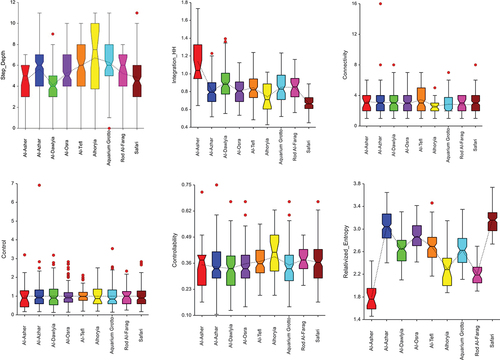
Figure 8. Number of observed visitors in Al-Dawlyia park (left) and Al-Azhar park (right). notes: the pie charts are the locations of the virtual gates where the counts were taken. For colour illustrations, please refer to the electronic version of the article.
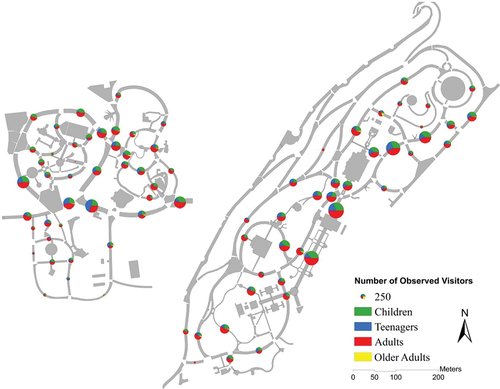
Figure A1. Locations of the nine selected parks within Greater Cairo Region.
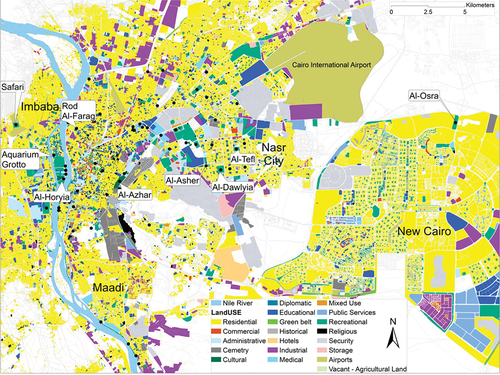
Table A1. The demographic characteristics of the neighbourhoods within which the selected parks are located based on CAPMAS (Citation2017), Mohamed and Stanek (Citation2021), and Aly and Dimitrijevic, Citation(2022b).
Table A2. Space assessment predictors used in this study.
Table A3. Pearson correlation analysis between configurational attributes and movement observations.
Table A4. Multiple regression analysis with the number of observed walking visitors and predictor variables in Al-Azhar park.