Figures & data
Figure 1. Distribution of shopping malls in Indonesia.
Figure 2. The history of research developments arrangement of retail space in shopping malls.
Table 1. Factors space value of shopping mall.
Figure 3. The flow of triangulation method.
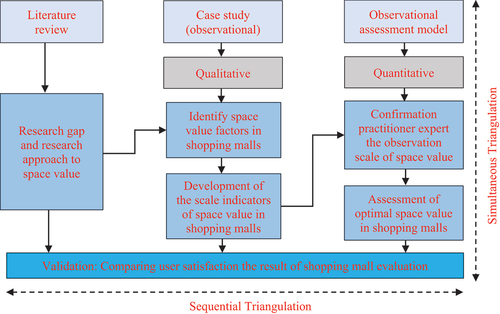
Figure 4. Territorial division and distribution of shopping malls in Jakarta and Surabaya, Indonesia.
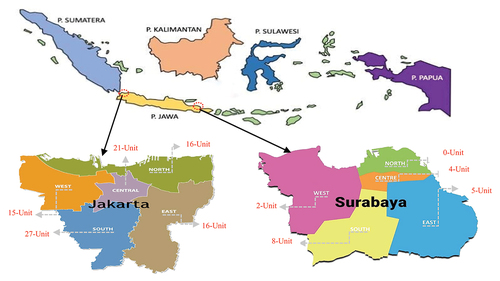
Table 2. Data shopping malls.
Table 3. Similarities and differences in the factor of space value in the shopping malls.
Table 4. Indicators for each space value factor.
Table 5. Scale value on the value of space shopping mall.
Figure 5. Level of application of the space value factor on shopping mall.
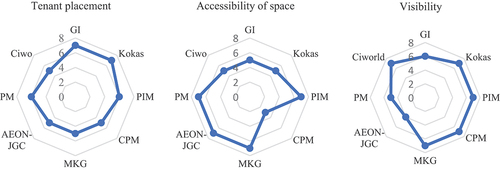
Table 6. Pairwise comparison matrix.
Table 7. Normalized criterion degrees.
Table 8. Evaluation of attribute.
Figure 6. Illustration of a shopping mall chart with the best value in spatial planning.
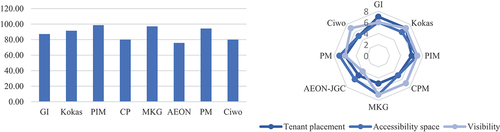
Figure 7. Crowd level for each floor (weekdays).
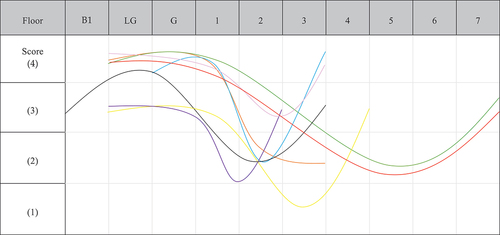
Figure 8. Crowd level for each floor (weekend).
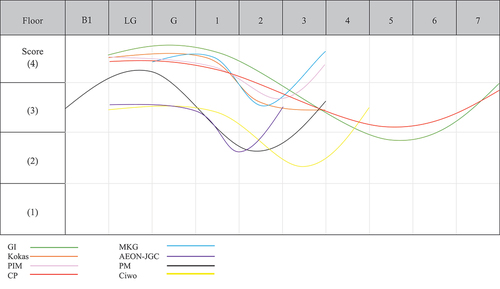
Figure 9. Tenant placement in PIM shopping mall (source: Author archives).
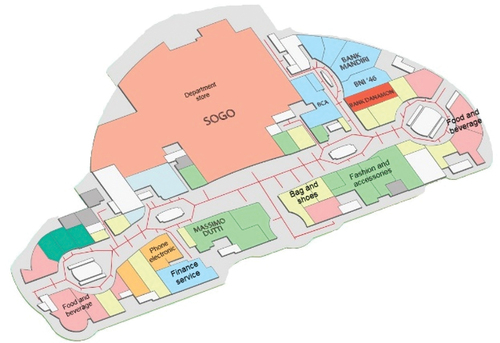
Figure 10. Ease of vertical accessibility through vertical transportation (escalators and elevators) in MKG (a); ease of horizontal accessibility through the use of bridges between corridors in PIM (b) (source: Author archives).
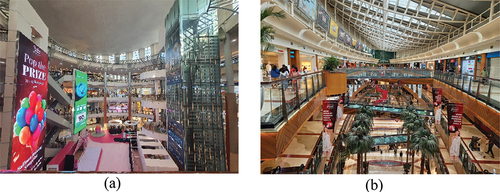
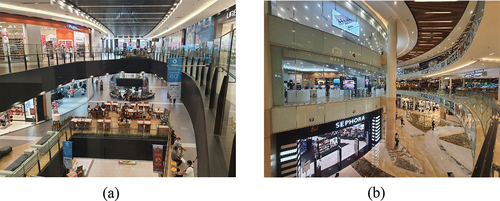
Figure 11. Limited visual access for visitors in AEON (a); ease of visitor visibility in Kokas (b) (source: Author archives).