
Figures & data
Figure 1. Some similar spatial features between Lisboa, Portugal, and Macau, China (image source: photographed by the author in 2019 and 2023, respectively).
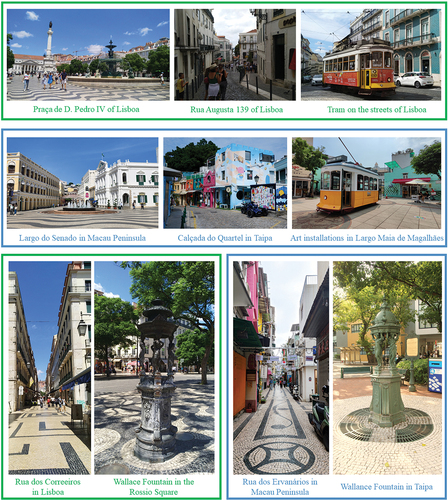
Figure 2. Research area (the first two images show the location of the four cities examined in Portugal, and the location of the Macau Peninsula and the outlying islands in Macau; the remaining maps represent the urban form areas under study).
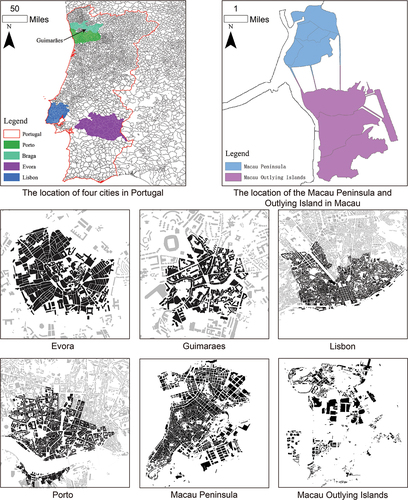
Figure 3. Research flow chart.
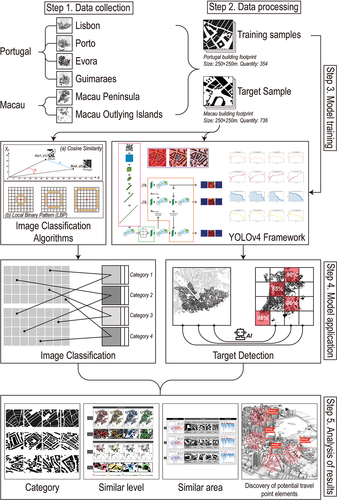
Figure 4. Sample processing of architectural textures in four cities in Portugal (the red in the figure shows the selected areas, and the numbers show the number assigned to each area).
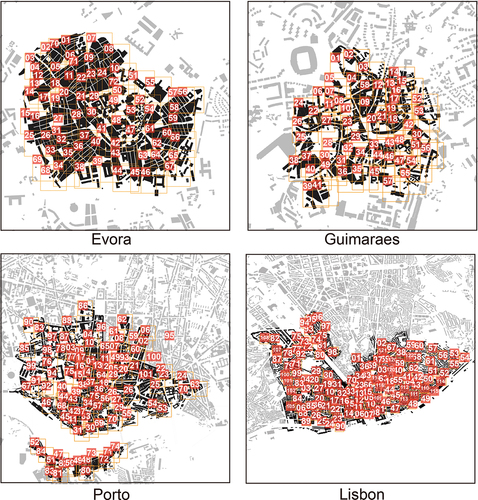
Figure 5. Material processing of the experimental object (the red boxes show the position of the first slice, and the blue boxes show the position of the second slice; a total of two rounds of slices are conducted after screening, and 736 pictures are obtained as the experimental objects).
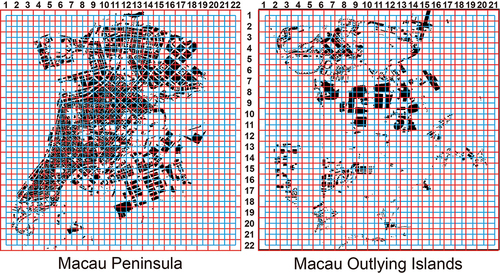
Figure 6. Material handling results. (1) Évora; (2) Guimaraes; (3) Porto; (4) Lisboa; (5) Macau Peninsula; (6) Macau’s outlying islands.
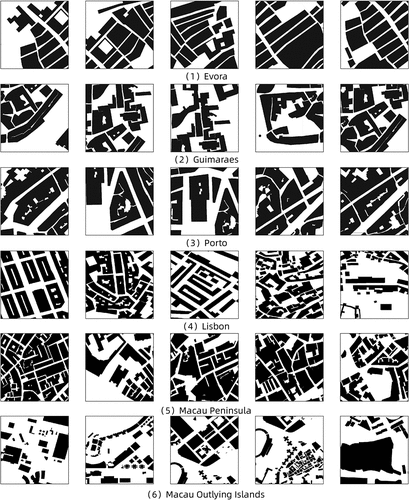
Figure 7. YOLOv4 model architecture design.
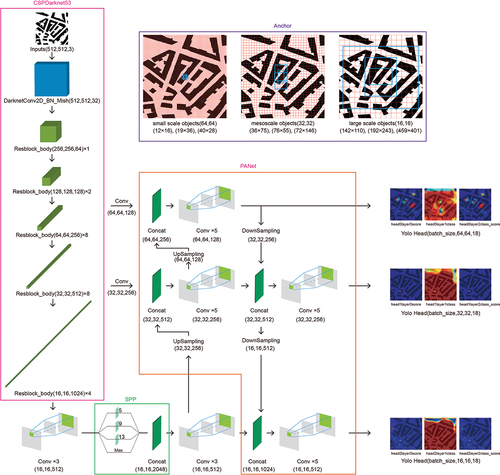
Figure 8. Model training accuracy metrics. (a) represents Évora and Porto; (b) represents Lisbon and Guimarães.
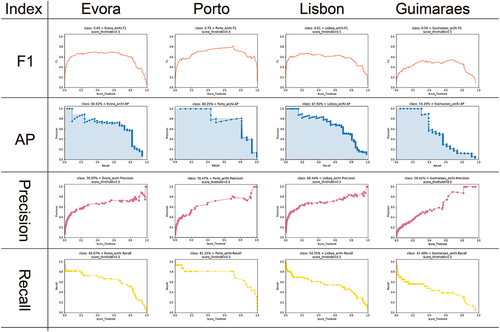
Figure 9. Model testing.
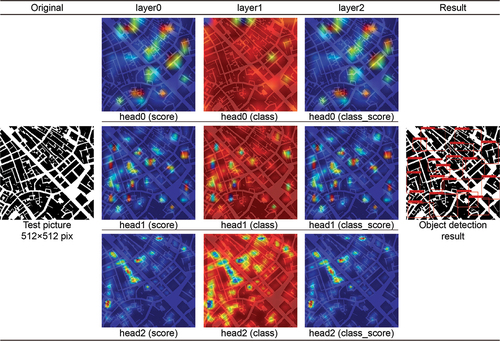
Figure 10. Cosine similarity principle.
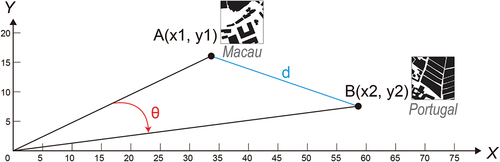
Figure 11. Local binary patterns (LBP).
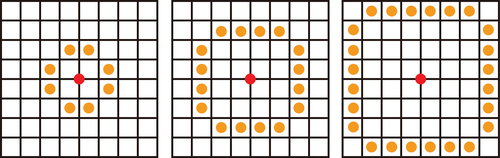
Figure 12. Slice sample number statistics (different colors represent different Portuguese cities.).
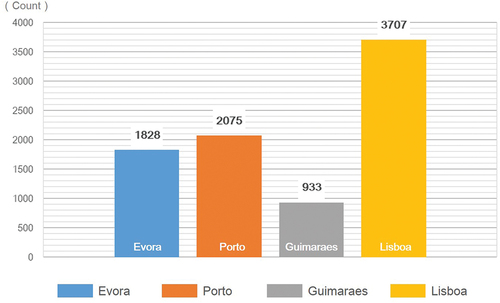
Figure 13. Similar morphological identification map of Macau (including the Macau Peninsula and Macau’s outlying islands) and the four cities of Portugal (red represent areas similar to Évora; yellow represents areas similar to Porto; sky blue represents areas similar to Guimarães; and fluorescent green represents areas similar to Lisboa.).
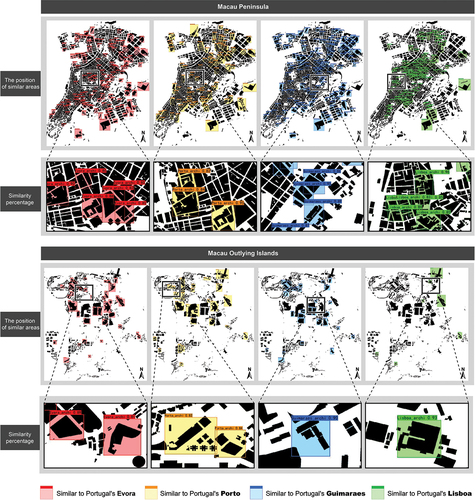
Figure 14. Comparing the similarity between the Macau slice samples and all the Portuguese city slices: (a) the similarity between the Macau Peninsula sample and all the Portuguese city slices; (b) the similarity between the Macau outlying island sample and all the Portuguese city slices.
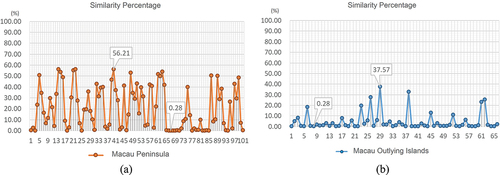
Figure 15. Comparison of the similarity between the Macau slice samples and the Portuguese city slices selected by the algorithm: (a) the similarity between the samples from the Macau Peninsula and the Portuguese city slices selected by the algorithm; (b) the similarity between the samples from Macau’s outlying island and the Portuguese city slices selected by the algorithm.
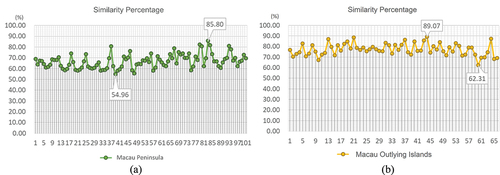
Figure 16. Street network form in the Macau Peninsula: a morphological comparison between samples from the Macau Peninsula and algorithmically identified slices of Portuguese cities (group 1 represents the serial number and similarity between Macau Peninsula sample slice No. 596 and similar sample slices from the other four Portuguese cities. Group 2 represents the serial number and similarity between Macau Peninsula sample slice No. 607 and similar sample slices from the other four Portuguese cities).
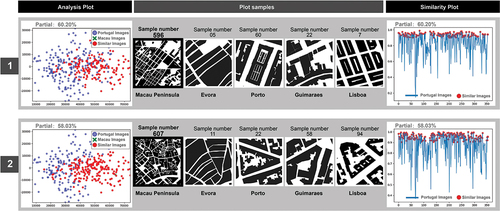
Figure 17. Street block form in the Macau Peninsula: a morphological comparison between samples from the Macau Peninsula and algorithmically identified slices of Portuguese cities (group 1 represents the serial number and similarity between Macau Peninsula sample slice No. 542 and similar sample slices from the other four Portuguese cities. Group 2 represents the serial number and similarity between Macau Peninsula sample slice No. 601 and similar sample slices from the other four Portuguese cities).
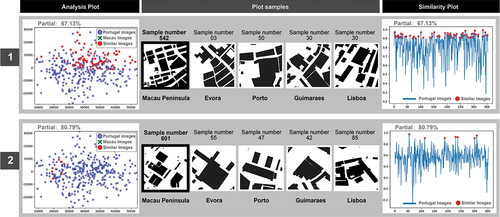
Figure 18. Form and distribution of square and open space in the Macau Peninsula: a morphological comparison between samples from the Macau Peninsula and algorithmically identified slices of Portuguese cities (group 1 represents the serial number and similarity between Macau Peninsula sample slice No. 571 and similar sample slices from the other four Portuguese cities. Group 2 represents the serial number and similarity between Macau Peninsula sample slice No. 634 and similar sample slices from the other four Portuguese cities).
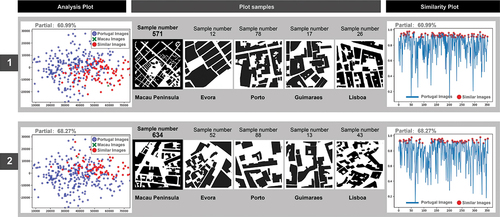
Figure 19. Form and distribution of buildings in the Macau Peninsula: a morphological comparison between samples from the Macau Peninsula and algorithmically identified slices of Portuguese cities (group 1 represents the serial number and similarity between Macau Peninsula sample slice No. 544 and similar sample slices from the other four Portuguese cities. Group 2 represents the serial number and similarity between Macau Peninsula sample slice No. 547 and similar sample slices from the other four Portuguese cities).
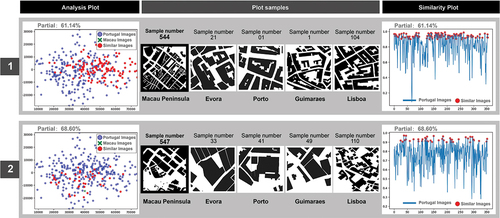
Figure 20. A morphological comparison between samples from the Macau outlying islands and algorithmically identified slices of Portuguese cities (group 1 represents the serial number and similarity between sample slice No. 137 from the Macau outlying islands and similar sample slices from the other four Portuguese cities. Group 2 represents the serial number and similarity between sample slice No. 509 from the Macau outlying islands and similar sample slices from the other four Portuguese cities. Group 3 represents the serial number and similarity between sample slice No. 97 from the Macau outlying islands and similar sample slices from the other four Portuguese cities.).
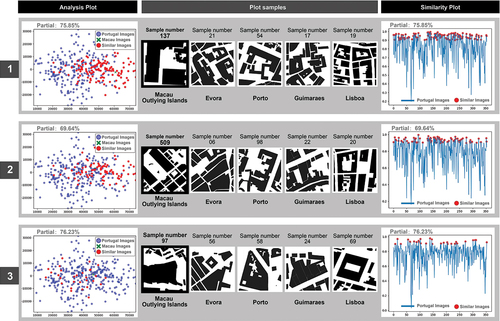
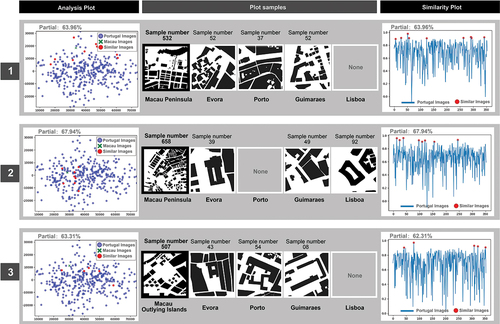
Figure 21. The similarity between the Macau samples and the Portuguese city slice samples selected by the algorithm is low (group 1 represents the serial number and similarity between Macau Peninsula sample slice No. 532 and similar sample slices from the other four Portuguese cities. Group 2 represents the serial number and similarity between Macau Peninsula sample slice No. 658 and similar sample slices from the other four Portuguese cities. Group 3 represents the serial number and similarity between sample slice No. 507 of the Macau outlying islands and similar sample slices from the other four Portuguese cities.).
Data availability statement
Research data of this study are included in this published article. Further information is also available from the Yile Chen on reasonable request.