
Figures & data
Figure 1. Structure of this paper.
Figure 2. Overview of the visibility measurement model.
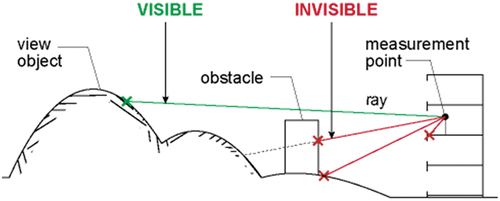
Figure 3. Process of visibility measurement.
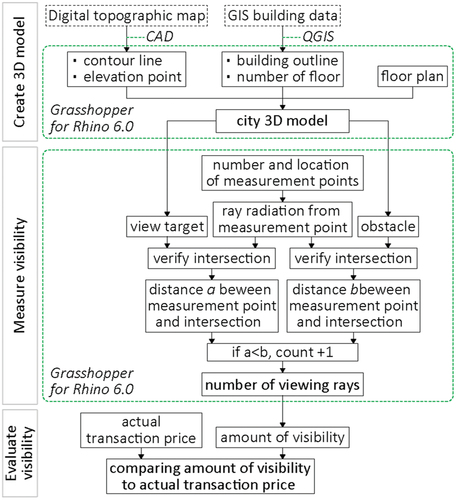
Figure 4. Overview of ray radiated from a measurement point.
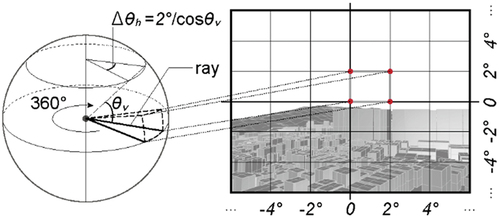
Figure 5. Example of viewing based on window size with the same amount of visibility.
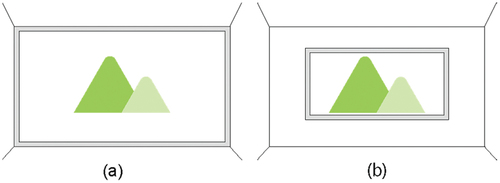
Figure 6. Representatives of the room.
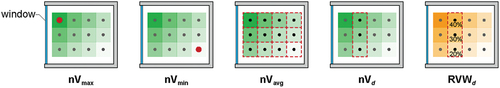
Figure 7. Location of the object apartments and view objects.
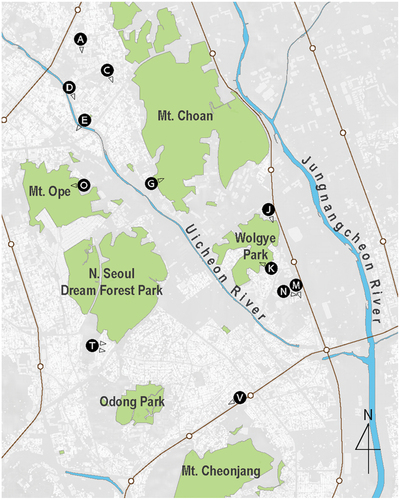
Table 1. Outline of the apartment subject.
Table 2. Number of data on each apartment unit.
Figure 8. Location of G2 and view object.
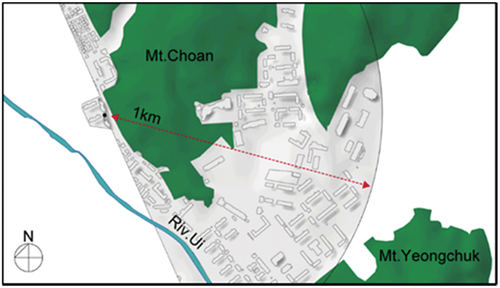
Figure 9. Floor plan and living room of G2.
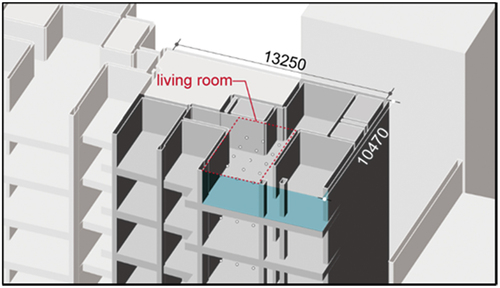
Figure 10. Boxplot of nV of sky on each floor.
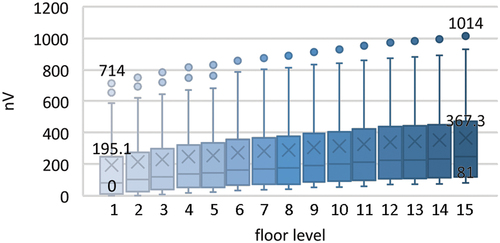
Figure 11. Average of nV of sky depending on distance from window of each floor.
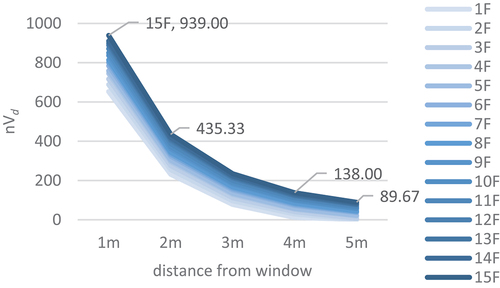
Figure 12. Average of ratio of sky to window depending on distance from the window of each floor.
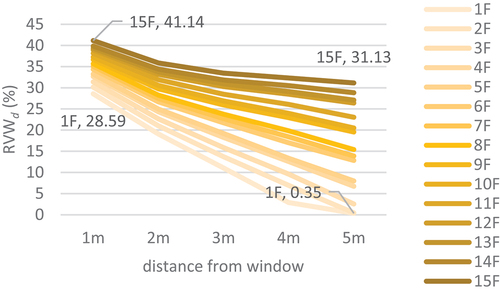
Figure 13. Heatmap of nV and RVW of sky on each measurement point of G2.
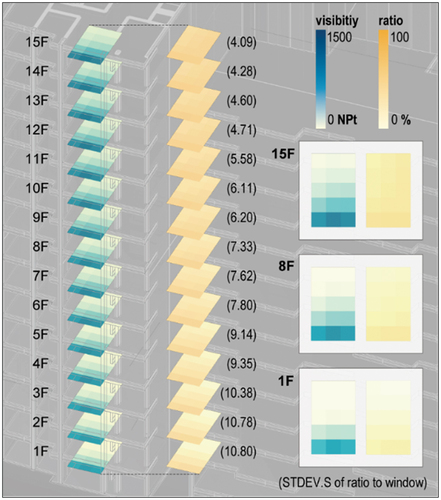
Figure 14. Sum of nV of each natural object on each floor.
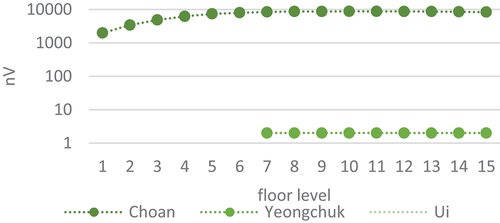
Figure 15. Boxplot of the nV of natural object on each floor.
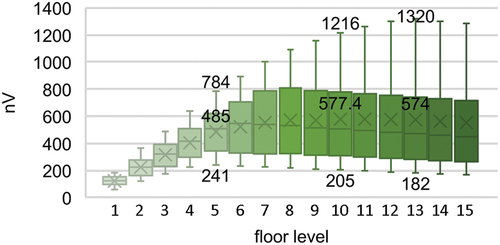
Figure 16. Average of nV of natural object depending on distance from the window on each floor.
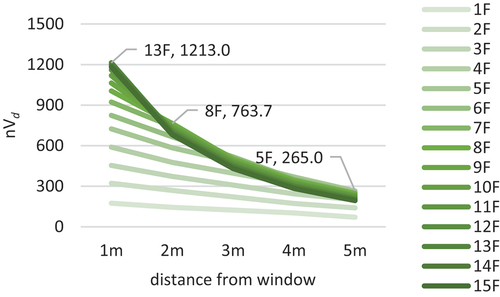
Figure 17. Average of the ratio of natural object to the window depending on the distance from window.
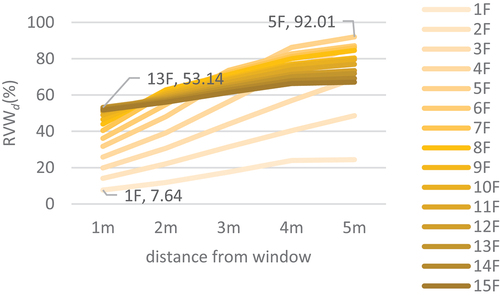
Figure 18. Heatmap of nV and RVW of natural object of G2.
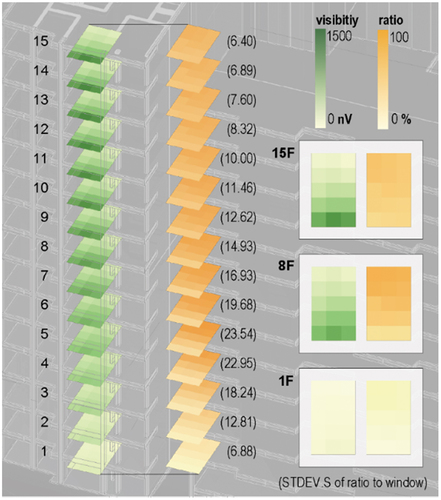
Table 3. Correlation coefficient of floor and view visibility with the real transaction price.
Table 4. Summary of evaluations on each apartment unit.
Figure 19. Comparison of the maximum (left) and average (right) of the visibility of the correlation coefficient with transaction price of each apartment unit.
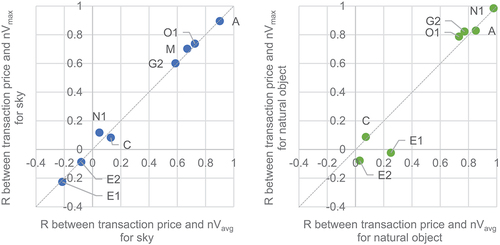
Figure 20. Comparison of the maximum (left) and average (right) of the visibility and the floor number of the correlation coefficient with transaction price of each apartment unit against the sky.
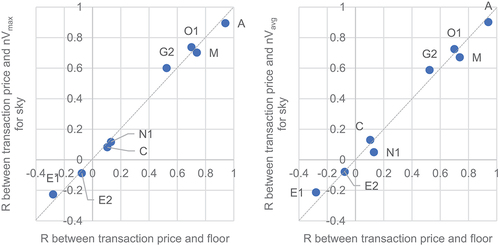
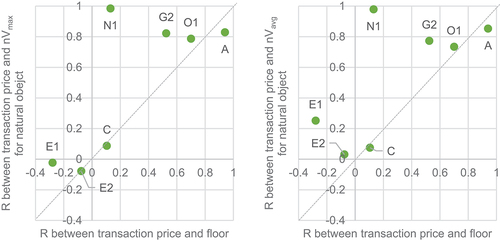
Figure 21. Comparison of the maximum (left) and average (right) of the visibility and the floor number of the correlation coefficient with transaction price of each apartment unit against the natural object.
Data availability statement
The data that support the findings of this study are openly available; in Korean Statistical Information Service (KOSIS) at https://kosis.kr/statHtml/statHtml.do?orgId=408&tblId=DT_KAB_11672_S1, reference number 26; Ministry of Land, Infrastructure and Transport, Korea (MOLIT) at http://rtdown.molit.go.kr/, reference number 37; National Spatial Data Infrastructure Portal at http://data.nsdi.go.kr/dataset/12623, reference number 41; and Naver Real Estate at https://land.naver.com/, reference number 42.