
Figures & data
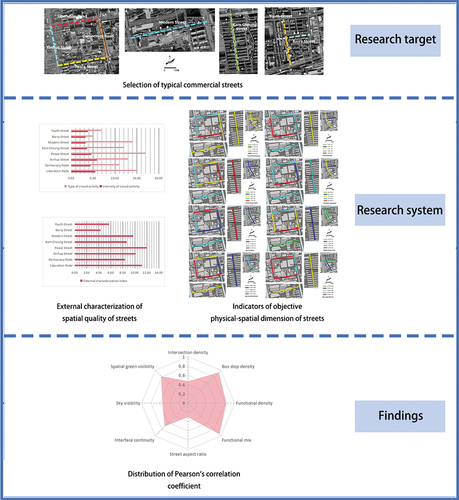
Figure 1. Selection of typical commercial streets.
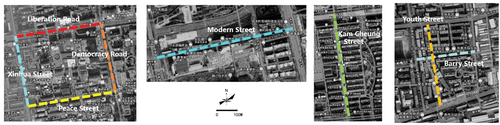
Table 1. Selection of typical commercial streets.
Figure 2. Methodology flow chart.
Figure 3. Technology roadmap.
Table 2. Classification of POI data in Gaode Maps.
Figure 4. Street view image data processing.
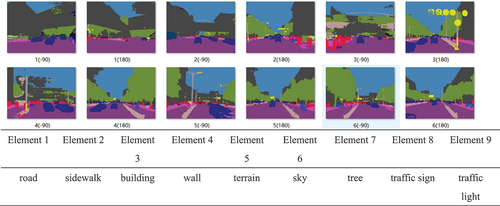
Table 3. Index quantization table.
Figure 5. Crowd activity indications.
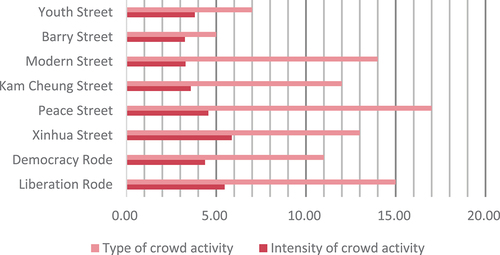
Figure 6. Quantitative map of the external representation.
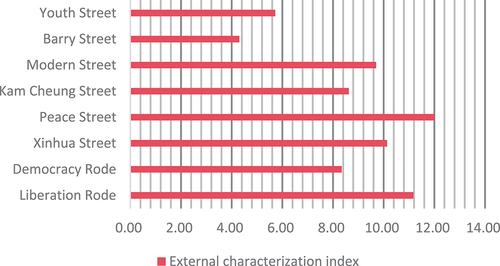
Figure 7. Quantitative map of objective material spatial indicators.
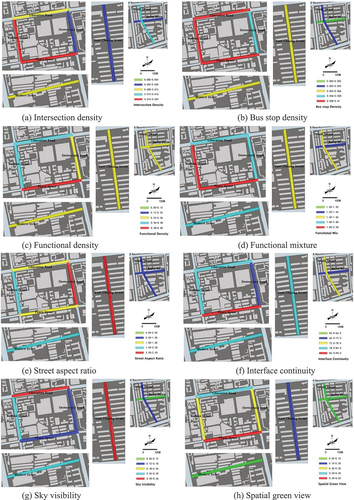
Figure 8. Pearson’s correlation coefficient statistics.
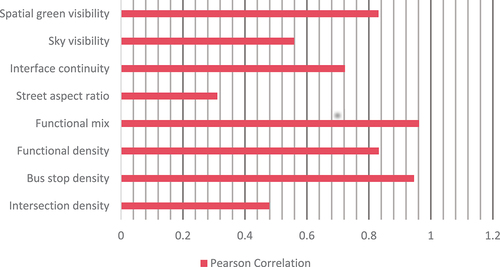
Figure 9. Distribution of Pearson’s correlation coefficient.
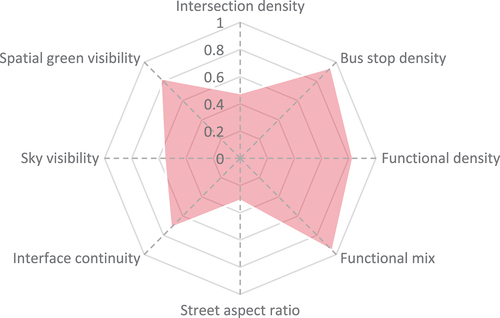
Table 4. The correlation between external representation and objective material space.