
Figures & data
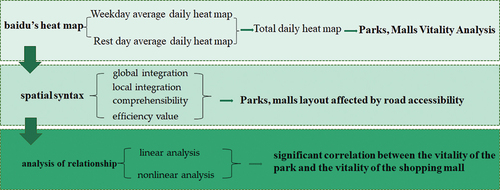
Figure 1. Spatial distribution of POI data points.
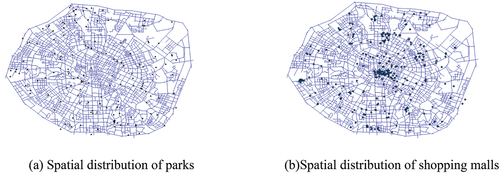
Figure 2. Research route.
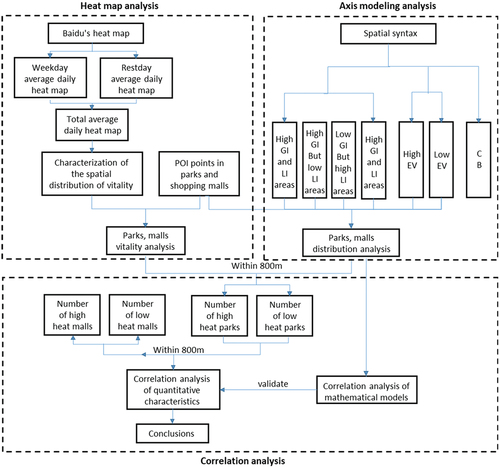
Figure 3. Daily average heat map.
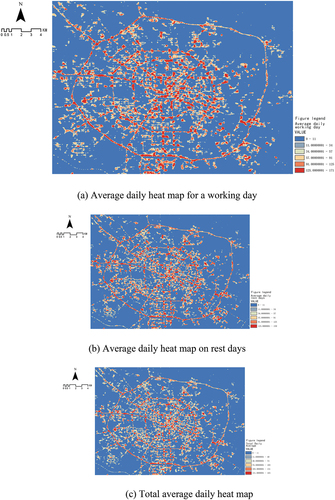
Figure 4. Distribution of parks and shopping malls.
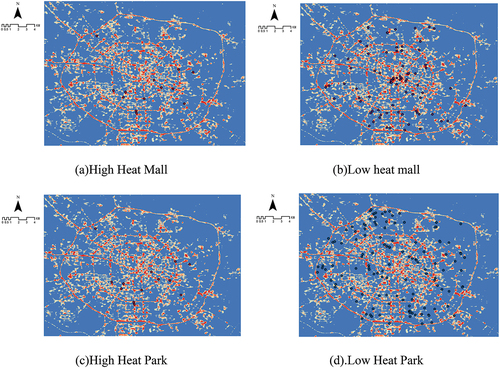
Figure 5. Overlay of high heat park, mall and global integration.
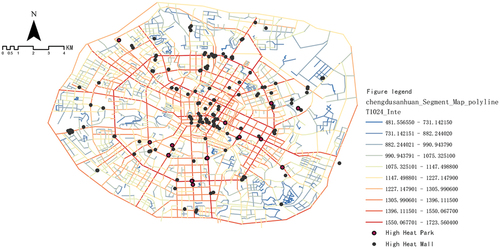
Figure 6. Overlay of high heat park, mall and local integration degree.
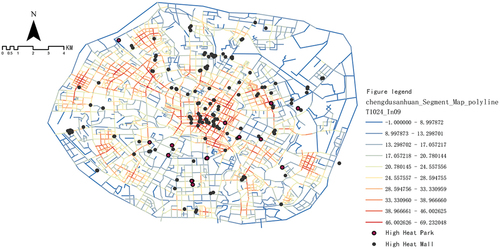
Figure 7. Integration degree screening chart.
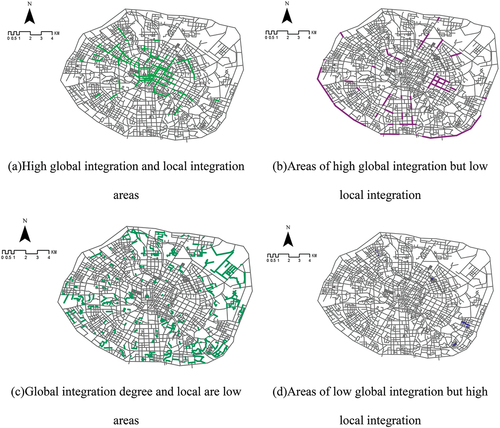
Table 1. Number of parks and malls statistics (degree of integration).
Figure 8. Comprehensibility of the axial system within the three rings.
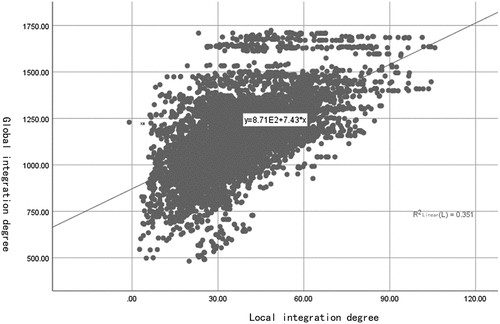
Figure 9. High heat park, mall and efficiency value overlay graph.
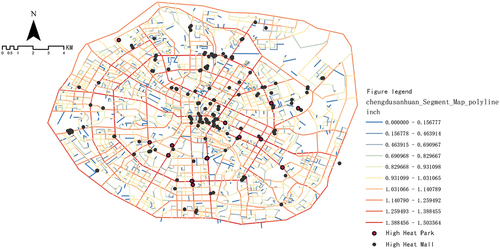
Table 2. Number of parks and malls statistics (Efficiency Values).
Table 3. Correlation analysis between park vitality and mall vitality.
Table 4. Nonlinear correlation analysis of park vitality and shopping mall vitality.