
Figures & data
Table 1. The composition of the color samples.
Table 2. The composition of participants.
Figure 1. Flow chart of statistics.
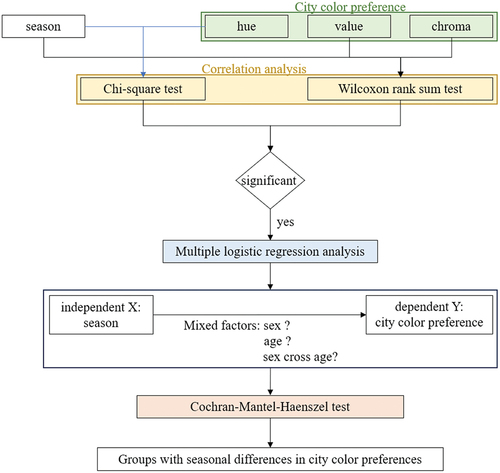
Table 3. Season * hue cross tabulation.
Table 4. Results of chi-square test.
Figure 2. Seasonal changes in value and chroma preference of city color.
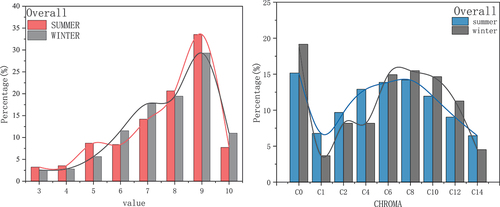
Table 5. Results of wilcoxon rank sum test of value and chroma preference.
Table 6. Results of parameter estimates (The reference category: Y).
Table 7. Results of parameter estimates (The reference category: GY).
Table 8. Season * hue * sex cross tabulation.
Table 9. Results of CMH test.
Table 10. Season * hue * age cross tabulation.
Table 11. Results of CMH test.
Table 12. Season * hue * age * sex cross tabulation.
Table 13. Results of CMH test.
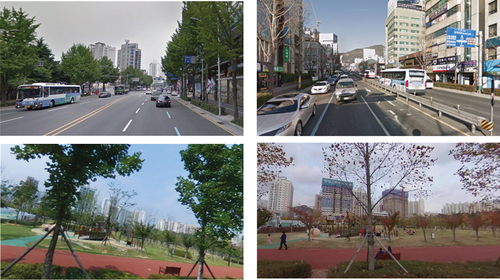
Figure 3. Environment vision in summer (left) and winter (right) of Busan city.
Data availability statement
The data that support the findings of this study are available from the corresponding author, upon reasonable request.