
Figures & data
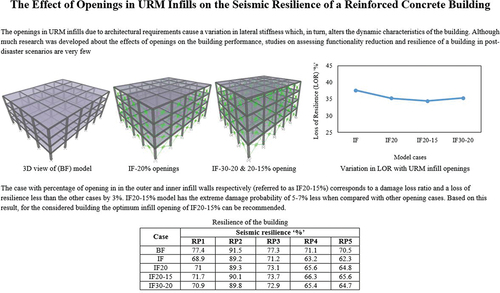
Figure 1. Infill frame stiffness reduction factor in proportion to percentage of openings (Asteris Citation2012).
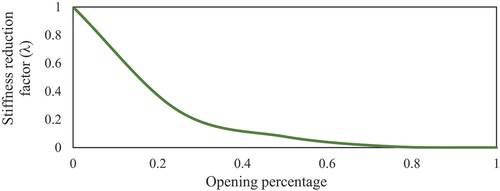
Figure 2. Plan layout [24].
![Figure 2. Plan layout [24].](/cms/asset/5b1a9212-aa1e-4dc8-80a3-c5a03e658796/tabe_a_2378002_f0002_b.gif)
Figure 3. Three dimensional view of (BF) model.
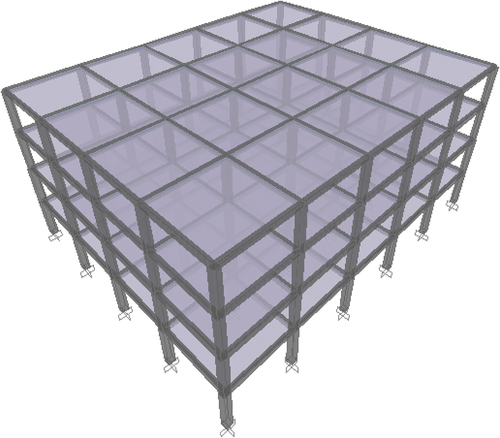
Figure 4. Elevation of the building.
Table 1. Considered building model cases.
Table 2. Properties of the considered materials.
Figure 5. Concept of resilience and associated parameters.
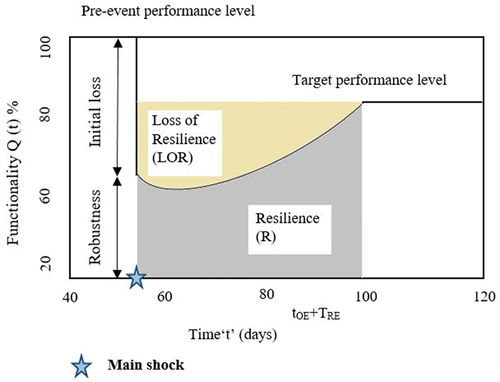
Table 3. Comparison of modal time periods for each building case.
Table 4. Cumulative damage probability.
Table 5. Discrete damage probability.
Figure 6. Fragility curves for BF case.
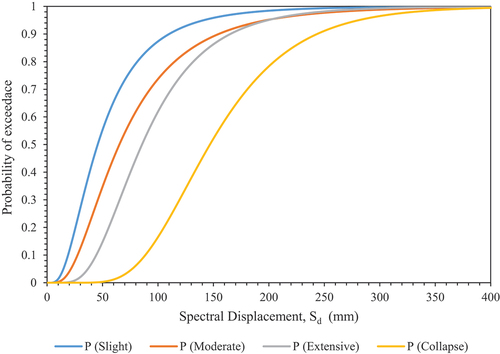
Figure 7. Fragility curves for if case.
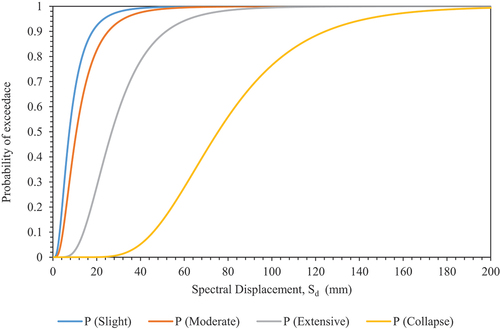
Figure 8. Fragility curves for IF20 case.
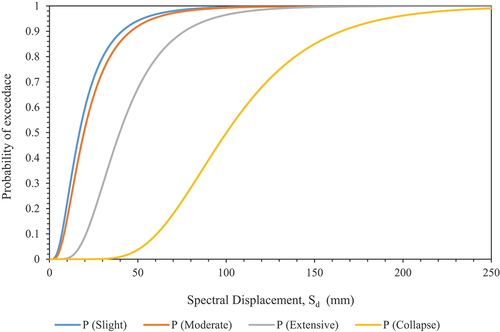
Figure 9. Fragility curves for IF20–15 case.
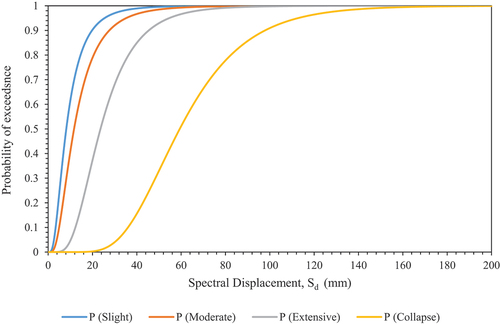
Figure 10. Fragility curves for IF30–20 case.
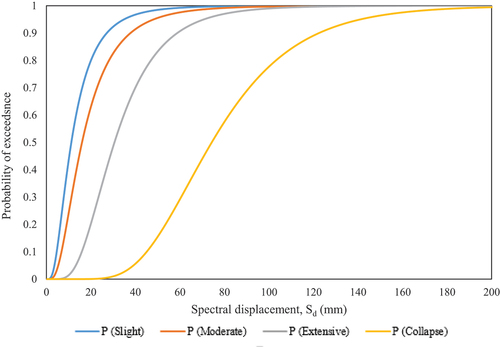
Table 6. Damage loss ratio for each building cases.
Figure 11. Functionality curve under various recovery path (Prasanth, Ghosh, Kumar Gupta, Casapulla, et al. Citation2023).
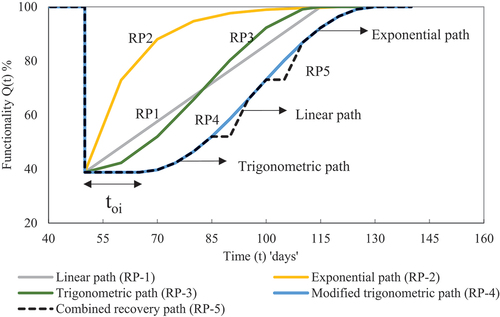
Figure 12. Functionality curves for BF case.
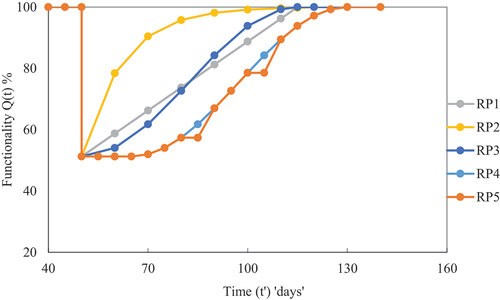
Figure 13. Functionality curves for if case.
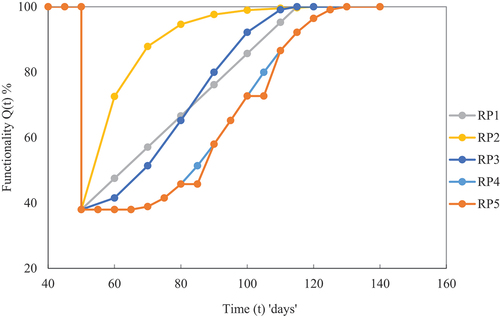
Figure 14. Functionality curves for IF20 case.
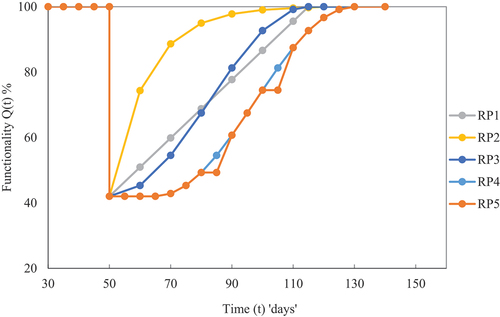
Figure 15. Functionality curves for IF20–15 case.
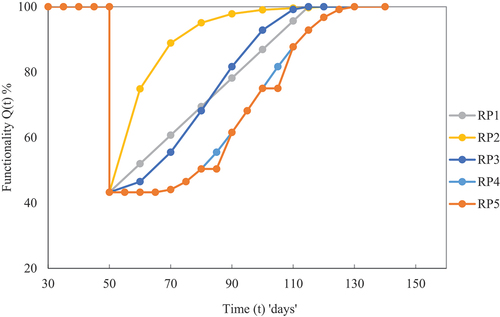
Figure 16. Functionality curves for IF30–20 case.
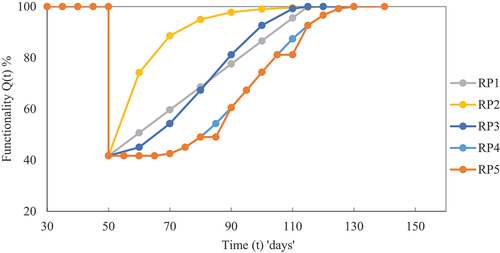
Table 7. Resilience of the building.
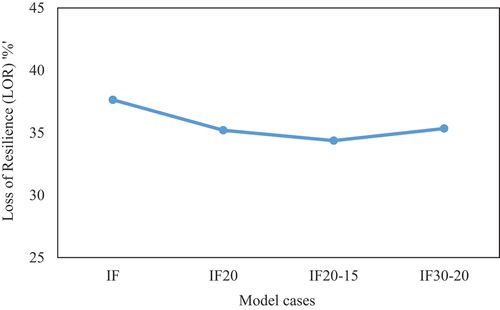
Figure 17. Variation in LOR with URM infill openings.
Data availability statement
All required data have been provided in the manuscript.