Figures & data
Figure 1. Trends in systemic salience, polarization, and politicization. Note: The figures show the salience, polarization, and politicization (salience X polarization) of European integration and immigration by campaign. The trends are based on locally weighted smoothing (LOWESS). The horizontal dashed lines serve as benchmarks, indicating the mean and mean + std. dev. values across 17 issue categories (see Appendix B). The vertical dashed lines indicate the start of the financial crisis in 2008, the Eurocrisis in 2010, and the refuges crisis in 2015.
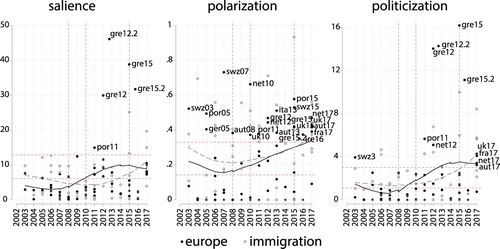
Figure 2. Marginal effects of the ‘politicizing party’ score by region, party type, and period. Note: The figure shows the marginal effects of party-level politicization from a three-way interaction of region, party group, and period (pre-2008; 2009–2017). Confidence interval levels 84.4% (i.e. if C.I. do not overlap it means that there is a significant change at α = 0.05).
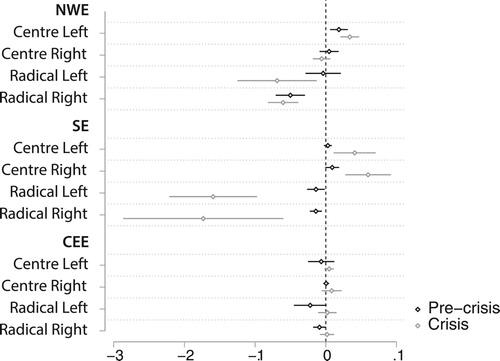
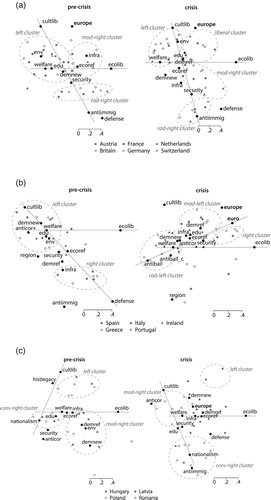
Figure 3. Configuration of party competition by region (crisis = post-2008). (a) Northwestern Europe. (b) Southern Europe. (c) Central-Eastern Europe.