Figures & data
Figure 1. Topics in executive board members’ speeches, 2001–2017. Notes: Frequency indicates the probability of observing each word in the vocabulary of a given topic. Exclusivity identifies words associated with a topic that are unlikely to appear among the top words of another topic. Words’ labels are weighted by joint frequency and exclusivity. Words are presented in their stemmed form.
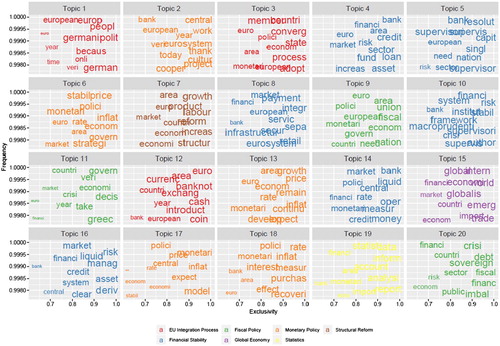
Figure 2. Topic prevalence over time in executive board members’ speeches, 2001–2017. Notes: Topics are ordered based on their average prevalence. Red horizontal lines refer to the average topic prevalence over the period of analysis (2001–2017). 95 percent confidence intervals are reported.
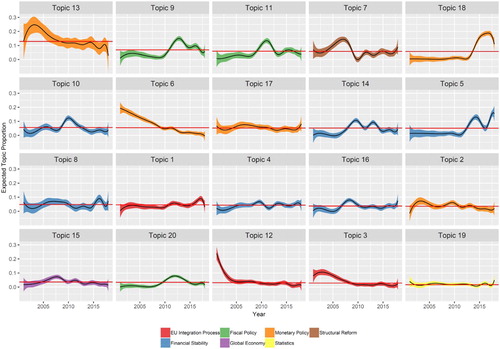
Table 1. Determinants of issue diversity and core salience in ECB speeches.
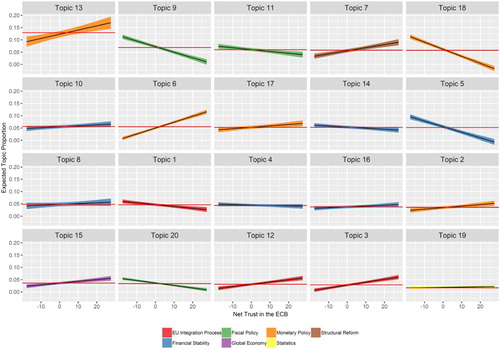
Figure 3. Topic prevalence in ECB communication and public trust in the ECB. Notes: Topics are ordered based on their average prevalence. Red horizontal lines refer to the average topic prevalence over the period of analysis (2001–2017). 95 percent confidence intervals are reported.