
Figures & data
Figure 1. Outcomes for FIs opened between 2004 and 2018 per member state. Source: Register (Citation2019).
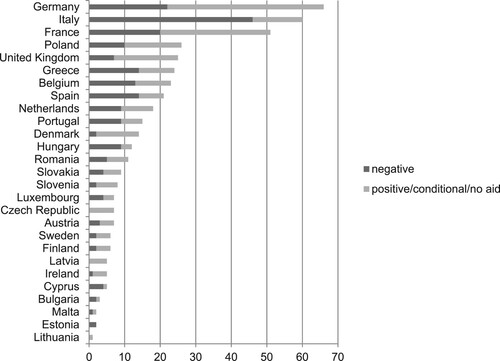
Table 1. Multilevel logistic models of the effects of variables on outcome of FIs (2004–2018).
Supplemental material
Figure 1. Outcomes for FIs opened between 2004 and 2018 per member state. Source: Register (Citation2019).
Table 1. Multilevel logistic models of the effects of variables on outcome of FIs (2004–2018).