
Figures & data
Table 1. TV coverage of the debate.
Table 2. Exposure to (live) TV debate among respondents (in %).
Table 3. Exposure to post-debate media coverage among respondents (in %).
Table 4. Regression models of Eurovision debate exposure on electoral participation.
Figure 1. Average marginal effect of debate watching on turnout by EU political interest.
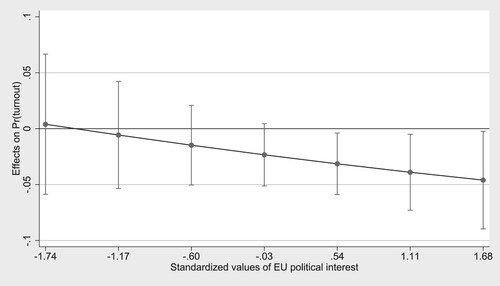
Figure 2. Effects of performance evaluations on party choice: (a) intended party choice in flash wave and (b) reported party choice in post-election wave.
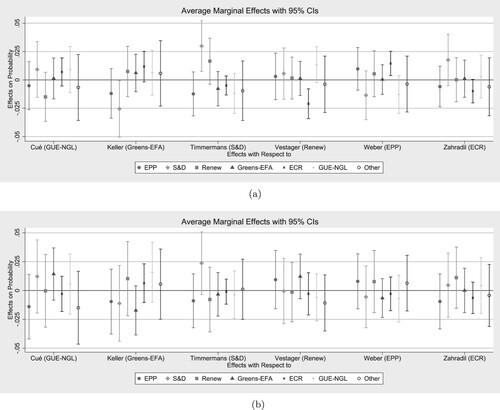
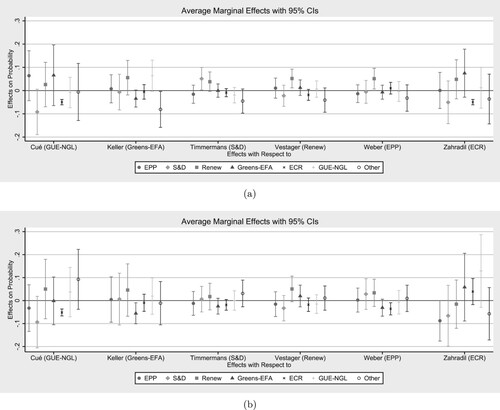
Figure 3. Effects of perceived debate winner on party choice: (a) intended party choice in flash wave and (b) reported party choice in post-election wave.
Supplemental material