
Figures & data
Table 1. Experimental groups.
Table 2. Overview of experimental groups.
Table 3. Descriptive statistics for the legitimacy index score per experimental group.
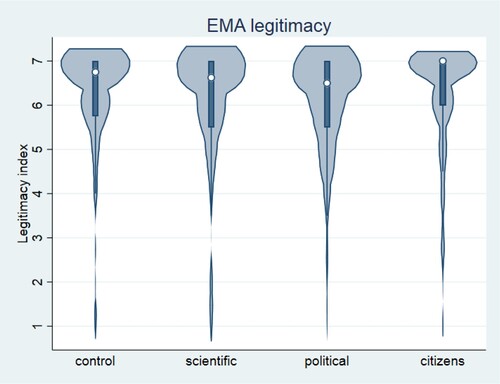
Figure 1. Violin plots for the index of legitimacy of the EMA (averaged answers to four questions measuring legitimacy on the scale from 1- 7, where lower scores indicate lower legitimacy). The white dot shows the median, the grey bar shows the interquartile range, and the vertical line extends to the highest and lowest value. The violin shows the estimated kernel density.
Data availability
The data that support the findings of this study are openly available in OSF at osf.io/qhtg9 [doi:10.17605/OSF.IO/QHTG9]