
Figures & data
Figure 1. Example policy portfolios of a single country at two points in time.
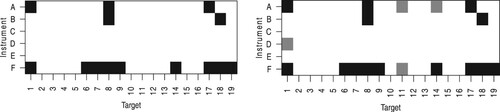
Figure 2. Determinants of environmental policy growth. Note: Our analysis covers 21 OECD countries over a period of 45 years (1976–2020). Note that all parameters are standardised to half a standard deviation and can therefore be roughly interpreted as the effect of an increase in one interquartile range; binary (EU) and continuous variables’ (all other) effects are directly comparable.
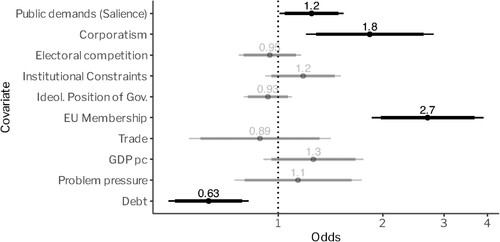
Figure 3. Determinants of environmental policy growth (disaggregated by instrument type). Note: Our analysis covers 21 OECD countries over a period of 45 years (1976–2020). Note that all parameters are standardised to half a standard deviation and can therefore be roughly interpreted as the effect of an increase in one interquartile range; binary (EU) and continuous variables’ (all other) effects are directly comparable.
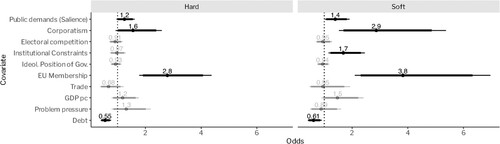
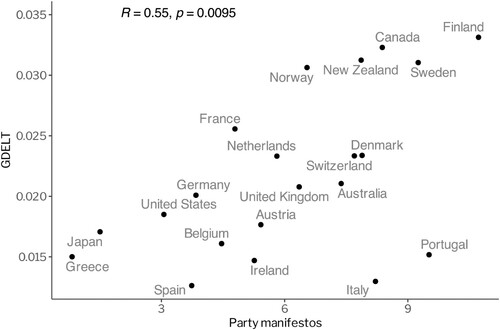
Figure 4. Correlation between the measures of salience for the environmental sector in media data and party manifestos, aggregated at the country level. Note: The figure compares environmental salience in media data and party manifestos for 21 OECD countries over a period of four years (2017–2021).
Supplemental Material
Download PDF (1.7 MB)Data availability
All data and replication files is accessible via the following link: http://xavier-fim.net/articles/jepp-2024.