Figures & data
Table 1. Material consumption per household from 1985 to 2000
Figure 1. Life-cycle environmental potential index of Chinese urban households.
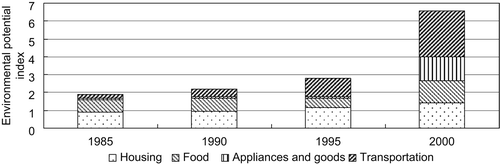
Figure 2. EPI patterns of housing consumption in 1985 and 2000.
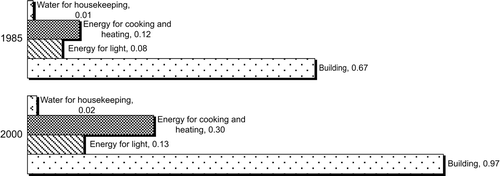
Figure 3. EPI patterns of food consumption in 1985 and 2000.
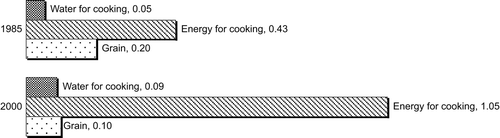
Figure 4. EPI patterns of appliance consumption in 1985 and 2000.
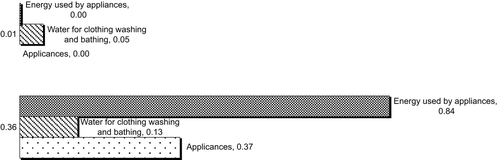
Figure 5. EPI patterns of transportation consumption in 1985 and 2000.
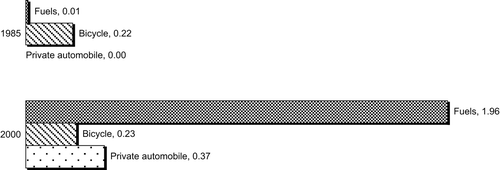
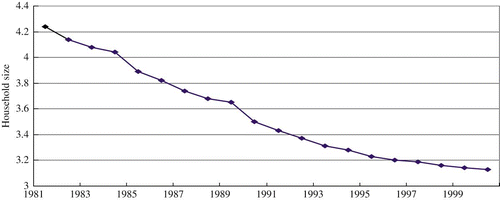
Figure 6. Changes in urban household size in China (1981–2000).