Figures & data
Figure 1. Distribution of emergency calls in Suwon between 2010 and 2014 (total number = 40). The crosses indicate the actual location of the calls. Each number in the figure indicates the results of cluster analyses involving a set of urban design variables described in the methods. (1) type I sites (high-rise building complexes with large in-between open space), (2) type II sites (low-rise, high-density residential districts), (3) type III sites (hilly terrain and sloped parkland).
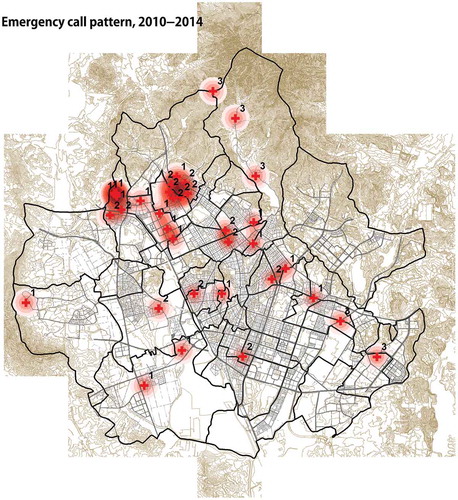
Figure 2. Cumulative heat vulnerability values by administrative units (Dongs), Suwon. Dark area indicates a neighborhood that might be highly vulnerable to heatwaves.
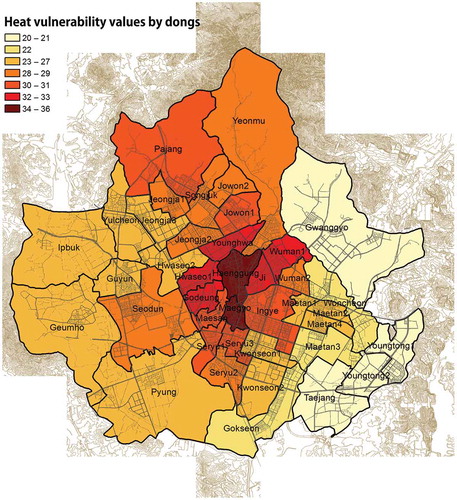
Figure 3. Results of average-linkage cluster analysis.
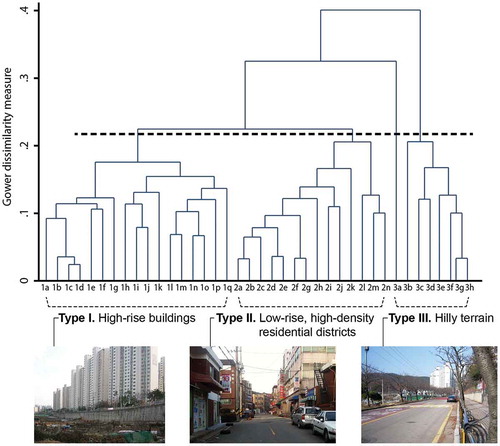
Figure 4. The site characteristics of type I, II, and III. The box plots indicate the 25th percentile (the left side of each box), the median, and the 75th percentile (the right side of each box). The whiskers represent the upper and lower adjacent values. Building footprint: the ratio of building footprint coverage compared to land area (%); urban geometry: the ratio of H/W, where H is the average height of building walls along a selected street and W is the width of the street; elevation: the height of emergency calls above sea level; road density: the ratio of the length of total road network to the land area within a 300 m distance from an emergency call location.
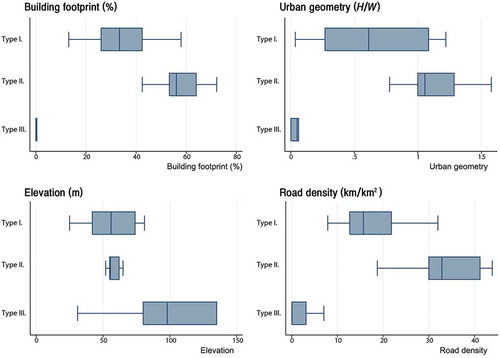
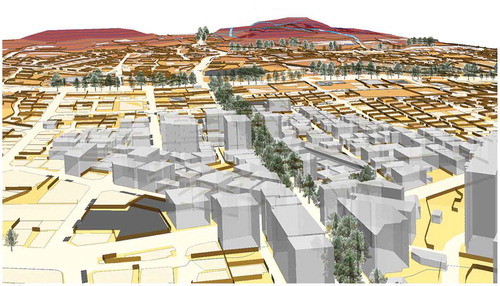
Figure 5. 3-D view of a typical type I site (the Yuljeon Public Housing complex).
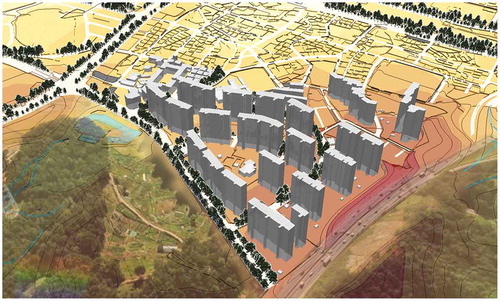
Figure 6. 3-D view of a typical type II site.