Figures & data
Figure 1. South-west coastal region of Bangladesh.
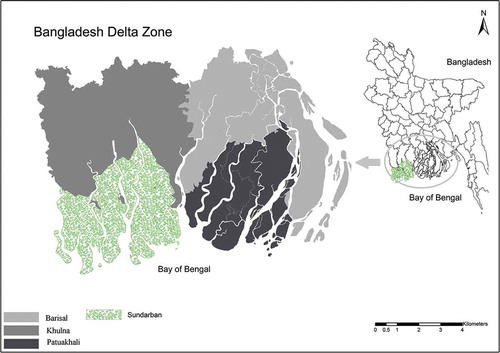
Figure 2. Trends of ecosystem services and of ecosystem service indicators in Bangladesh delta.
Figure 3. Trends of GDP (a) and GDP shared by different sectors (b) in Bangladesh delta.
Table 1. Target and current status of MDGs in regional (south-west Bangladesh delta) and national scale of Bangladesh.
Figure 4. Linear and nonlinear relationships between provisioning (rice and shrimp production) and regulating services. The central line represents estimated mean (spline), whereas the other two lines represent 95% (top lower and top higher) and 80% (middle two lines) credible interval, respectively.
Figure 5. Linear and nonlinear relationships between provisioning (fish and forestry production) and regulating services. The central line represents estimated mean (spline), whereas the other two lines represent 95% (top lower and top higher) and 80% (middle two lines) credible interval, respectively.
Figure 6. Linear and nonlinear relationships among the variables of regulating services. The central line represents estimated mean (spline), whereas the other two lines represent 95% (top lower and top higher) and 80% (middle two lines) credible interval, respectively.
Table 2. Logistics regression results of cross sectional data (HIES 2010) for analysing the relationship between quality of life (e.g. ‘electricity’, ‘safe drinking water’) and production at household level.
Table 3. Logistics regression results of cross sectional data (HIES 2010) for analysing the relationship between quality of life (e.g. ‘electricity’, ‘safe drinking water’) and fish catch at household level.
Figure 7. Connectivity between regulating and provisioning services since 1978. Curve of PCA axis 1 and 2 combined data both for the provisioning services (different varieties of crops) and seasonal regulating services, such as water discharges, temperature, and rainfall and water salinity since 1967. Moreover, black line represents the connectivity between regulating and provisioning services using 10-year moving window and line in dot shows the connectivity between regulating and provisioning services using 20-year moving window.
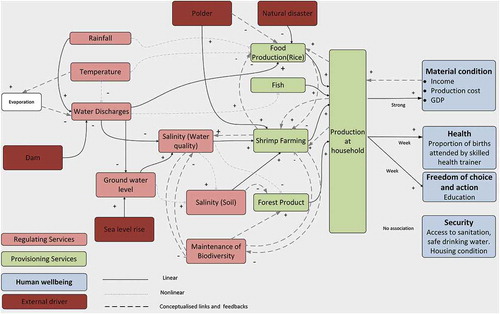
Figure 8. Hypothesized system dynamic framework for the social–ecological system in south-west coastal Bangladesh.