Figures & data
Figure 1. The designed approach to explore uncertainties in CLA for ADM.
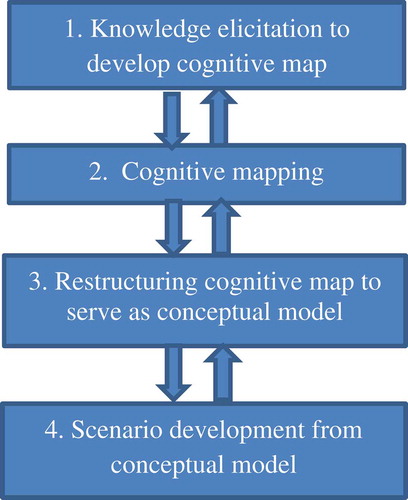
Figure 2. The study area: polder 30 and 31 in southwest region of Bangladesh.
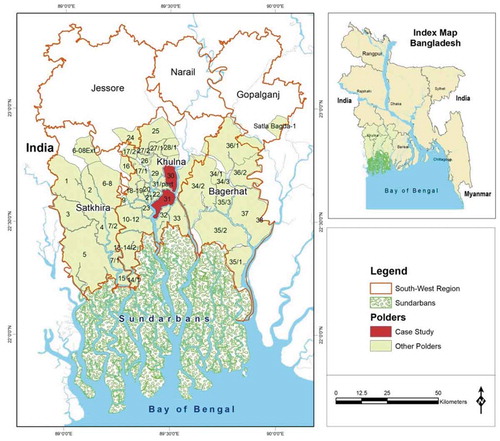
Figure 3. Cognitive map of farmer’s community for strategic cropping decision in the dry season. (‘ … ’ should be read as ‘rather than’ to express the contrasting pole). The rectangles represent farmer’s decisions, the arrows represent causal links and the rest are conditions.
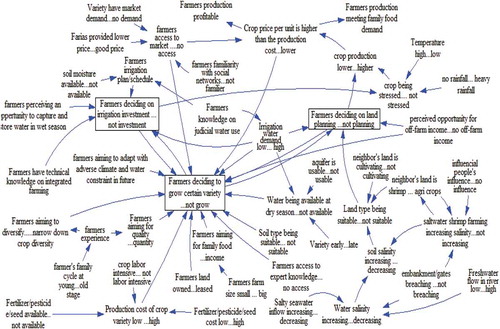
Figure 4. The conditions and relationship in the strategic decision on crop variety.
Figure 5. The cognitive map (restructured) to serve as a conceptual model.
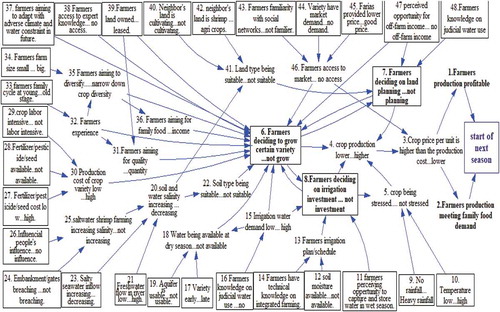
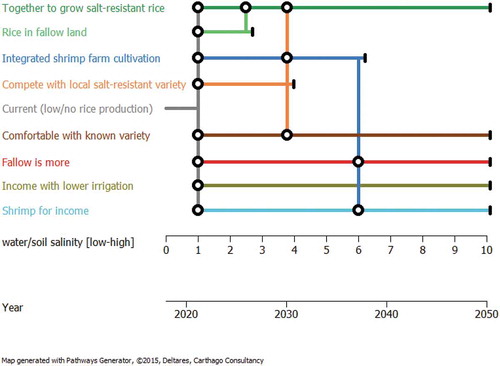
Figure 6. Livelihood adaptation pathway map: farmers possible response to salinization. All are for illustrative purposes only. The black (round) transfer stations illustrate the livelihood adaptation decision from one to other by local farmer communities. The black terminal has illustrated the condition in which a livelihood is not suitable anymore.