Figures & data
Figure 1. Changes in water management approaches in the South-west delta in Bangladesh.
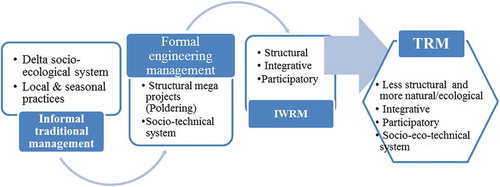
Figure 2. Triangular management system approach: Transformation pathways in the Socio-eco-technical system in a dynamic delta.
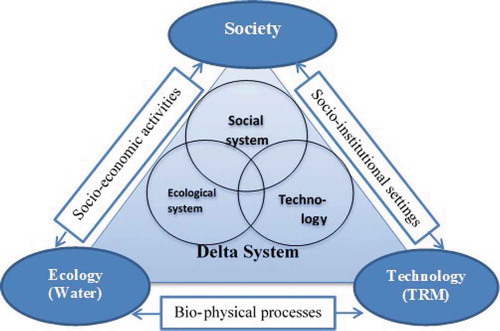
Table 1. Time scale for analysing delta system transformation in KJDRP area.
Figure 3. Tidal volume before, during, and after TRM in Hari River (at Ranai point)(IWM Citation2007; Citation2014).
Table 2. Land cover changes in KJDRP area.
Figure 4. Changing pattern of production system in the study area (Field survey, 2013–2015).
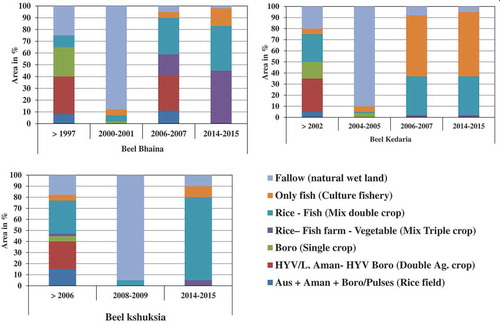
Figure 5. Livelihood system changes in Hari river catchment area in KJDRP (Field survey, 2013–2016).
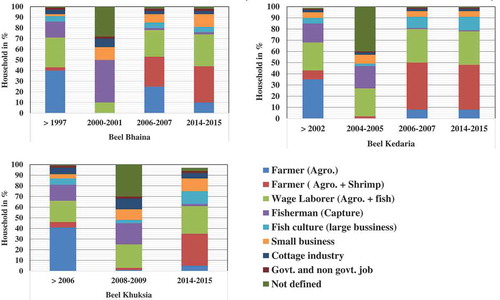
Figure 6. Trend of average household income in the study area (base year 1995–96) (Field survey, 2013–2016).
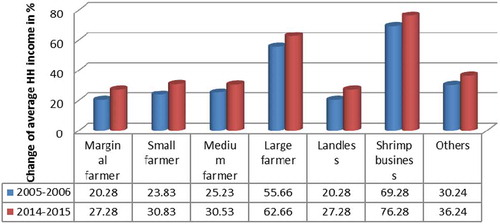
Figure 7. Acceptance of TRM projects in local Community (Field data, 2012–2013).
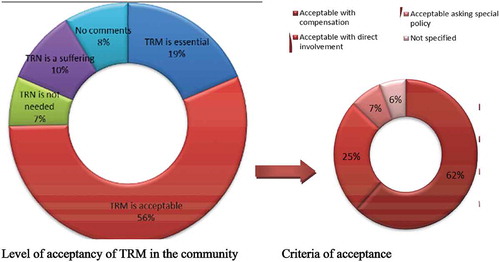
Table 3. Compensation activities due to TRM in KJDRP area.
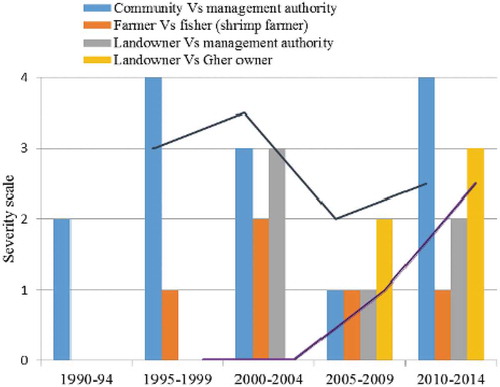
Figure 8. Severity of conflicts in terms of socio-economic straggle of local communities (Field survey, 2013–2016).