Figures & data
Figure 1. Global cumulative installed wind capacity (2001–2018) (Statista Citation2019)
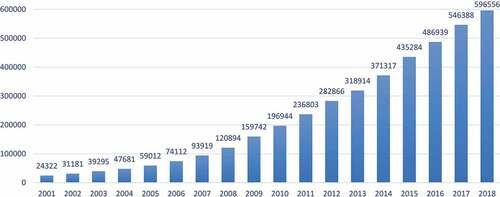
Figure 2. Annual cumulative wind power capacity (2011–2017) (Statista Citation2019)
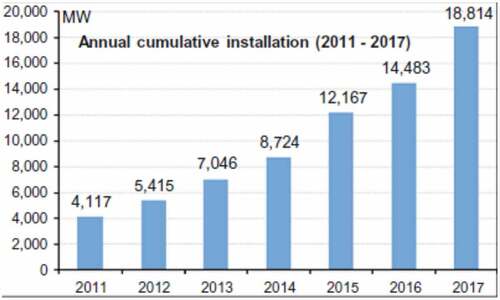
Figure 3. Annual avian mortality in the USA. Numbers show the lowest values of a range of estimates (Wang et al. Citation2015)
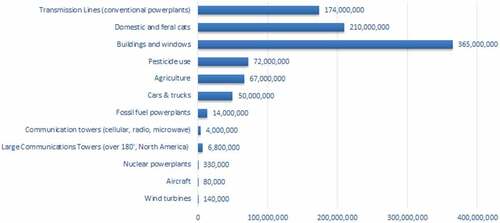
Figure 4. Physical processes between wind power and surface atmosphere (Wang and Wang Citation2015)
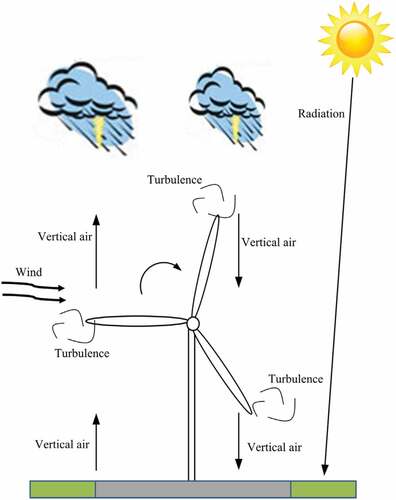
Figure 5. Livestock grazing on a wind farm (Alternative Energy Tutorials Citation2017)
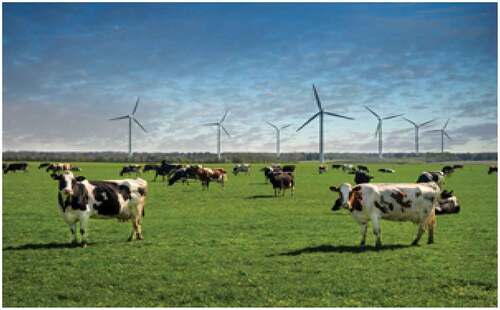
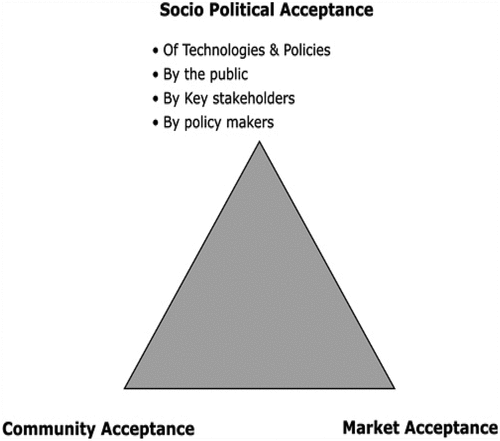
Figure 6. The triangle model of social acceptance (Lago et al. Citation2009)