Figures & data
Figure 1. Map of the Aksu headwater catchments and irrigation systems along the Aksu River (top) and true-colour composite satellite imagery of the region (~2020, bottom).
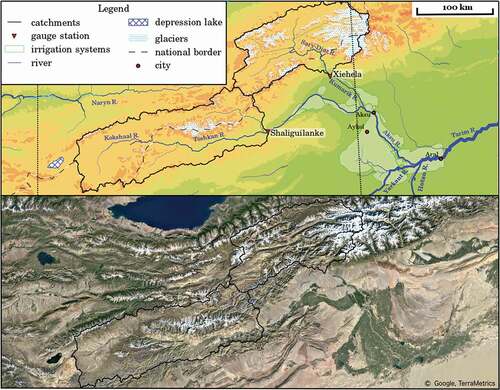
Table 1. Glacier contribution to total runoff for the Sary-Jaz River (measured at Xiehela station) and Kokshaal River (Shaliguilanke station); data sources glacier melt: Duethmann et al. (Citation2015), Pieczonka and Bolch (Citation2015), Zhao et al. (Citation2013), data source runoff: Yu et al. (Citation2011). The glacier contribution was calculated for the priod after 2000. No runoff data was available for the period after 2008. We consider the period 2000-2008 to be also representative for the period until 2020
Figure 2. Projected future changes in annual mean discharge of Sary-Jaz and Kokshaal catchments simulated by SWIM-G and WASA relative to the baseline period 1971–2000 for three different RPC scenarios (A); Projected seasonality changes in runoff for Aksu River (B), data source: Wortmann et al. (Citation2021)
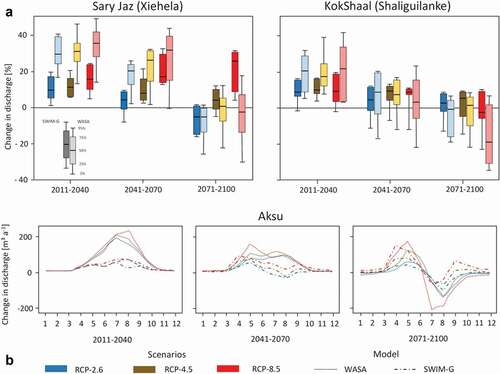
Figure 3. Landsat false colour mosaics (SWIR-NIR-RED) of the irrigated area around Aksu of about 1994 and 2020 (above) and classified land cover/land use of the year 2020 (below).
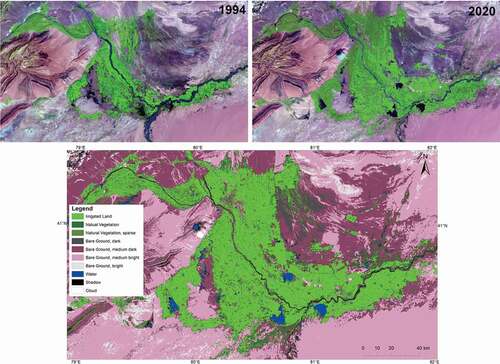
Table 2. Changes in irrigated land and annual water demand of the irrigated area. 1Average data calculated based on data from Wang et al. (Citation2019), p. 2 See 3 Estimated based on the average total runoff and the irrigation water demand
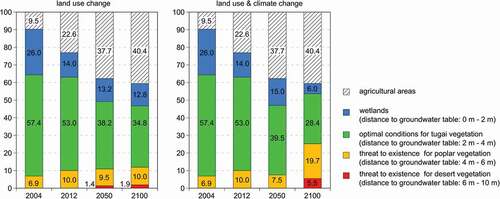
Figure 4. Changes in the vitality zones in future scenarios caused by land-use changes along the river oasis Yingibazar and land-use changes combined with climate change; source: Keilholz et al. (Citation2015)