4,793
Views
3
CrossRef citations to date
0
Altmetric
Research Article

Sustainable development, renewable energy transformation and employment impact in the EU

ORCID Icon, &
Pages 695-708 | Received 06 Jan 2022, Accepted 07 May 2022, Published online: 25 May 2022

Figures & data

Figure 1. Distribution of key variables: Renewable energy sources, non-renewable energy sources, total employment rate and GHG emissions.

Figure 1. Distribution of key variables: Renewable energy sources, non-renewable energy sources, total employment rate and GHG emissions.

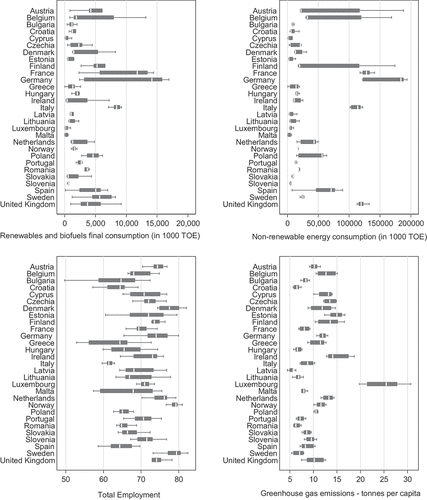
Table 1. PVAR results

Figure 2. Forecast Error Variance Decomposition (FEVD), shown as 5 and 10 years ahead responses to one standard deviation shock to non-renewables (left panel) and renewables (right panel). The measurements show how much shocks in renewables and non-renewables contribute to the future variability of the variables.

Figure 2. Forecast Error Variance Decomposition (FEVD), shown as 5 and 10 years ahead responses to one standard deviation shock to non-renewables (left panel) and renewables (right panel). The measurements show how much shocks in renewables and non-renewables contribute to the future variability of the variables.

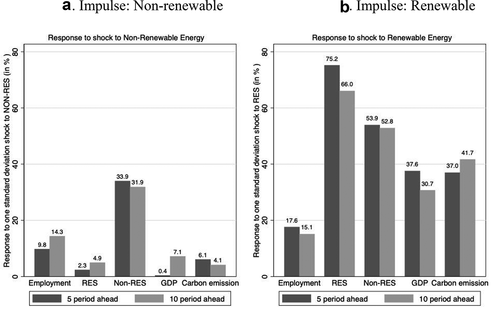
Table A1. Stability test for EU PVAR model

Table A2. Optimal lag selection for EU sample model

Table A3. Pesaran (Citation2007) CIPS unit root test

Table A4. Panel cointegration test