
Figures & data
Table 1. Definition of variables.
Table 2. Statistical description of data.
Figure 1. Box plot for variables.
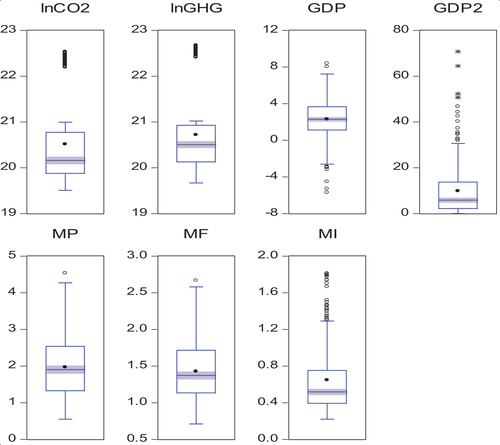
Figure 2. Scatterplot matrix for variables.
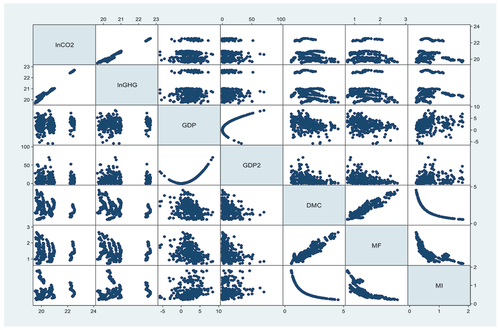
Table 3. Correlation analysis results.
Table 4. Cross-section dependence results.
Table 5. Pesaran and Yamagata (Citation2008) homogeneity test results.
Table 6. Pesaran (Citation2007) panel CADF unit root test results.
Table 7. Cross-section dependence results for Model a and Model B.
Table 8. Westerlund (Citation2008) panel cointegration test results.
Table 9. Long-run coefficients results (DOLSMG).
Figure 3. DOLSMG schematic results for Model 1.
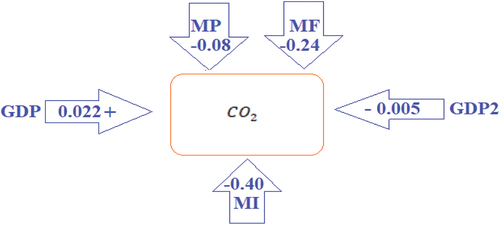
Figure 4. DOLSMG schematic results for Model 2.
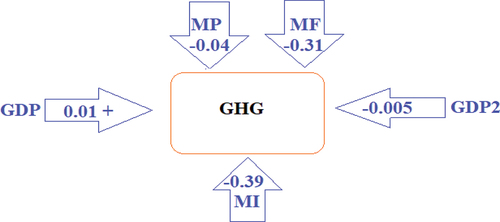
Table 10. Country-specific long run coefficients results.
Table 11. Dumitrescu and Hurlin (Citation2012) panel causality test results.