Figures & data
Figure 1. The natural color image showing the study areas of Fuzhou’s main urban area (a) and the zijin mining area (b).
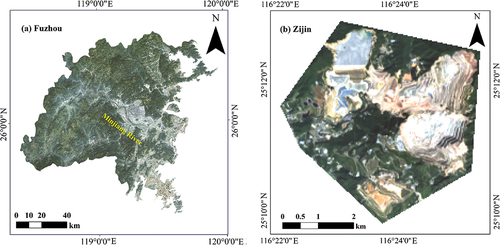
Table 1. The acquisition dates of each image and the average meteorological data for the five days preceding each acquisition date.
Figure 2. Feature spaces showing the principles for the construction of GEI.
Figure 3. Fitted soil lines of Fuzhou city in 2001, 2013, and 2020.
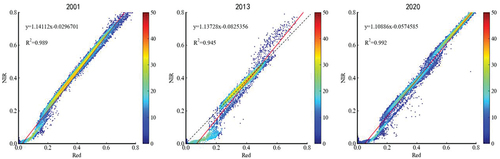
Figure 4. PVI images of Fuzhou City in 2001, 2013, and 2020.
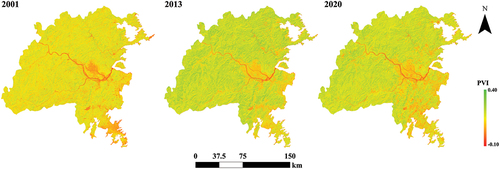
Figure 5. MPDI images of Fuzhou city in 2001, 2013, and 2020.
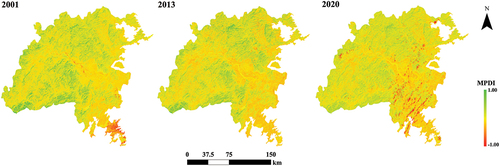
Figure 6. NDSI images of Fuzhou city in 2001, 2013, and 2020.
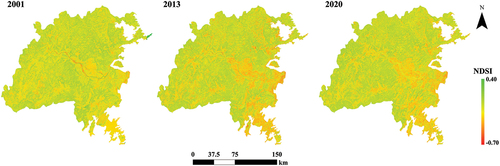
Figure 7. LST images of Fuzhou city in 2001, 2013, and 2020.
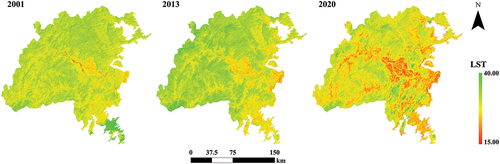
Figure 8. GEI analysis results of Fuzhou City in 2001, 2013, and 2020.
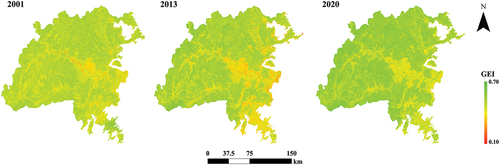
Table 2. Typical field inspection sites in Fuzhou City with their corresponding GEI values.
Figure 9. The 2020 image of Fuzhou (left) and its corresponding GEI (center) and RSEI (right) images.
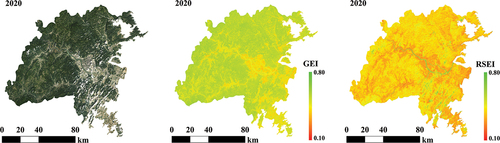
Figure 10. Fitted soil lines of the zijin mining area in 1992, 2014, 2018, and 2020.
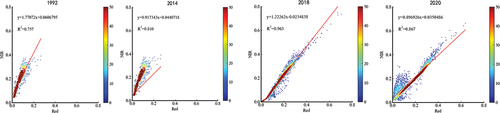
Figure 11. PVI images of the zijin mining area in 1992, 2014, 2018, and 2020.
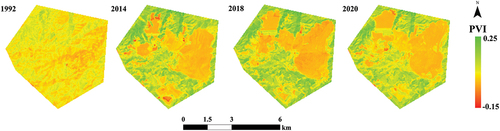
Figure 12. MPDI images of the zijin mining area in 1992, 2014, 2018, and 2020.
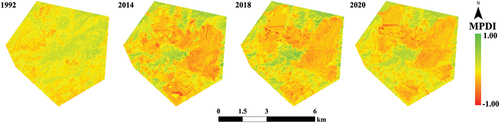
Figure 13. NDSI images of the zijin mining area in 1992, 2014, 2018, and 2020.
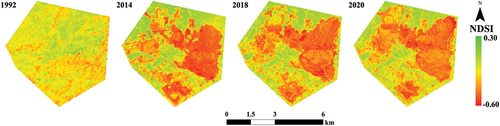
Figure 14. LST images of the zijin mining area in 1992, 2014, 2018, and 2020.
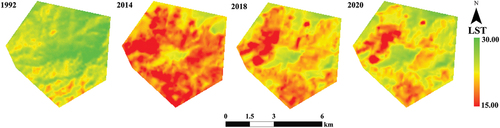
Figure 15. GEI images of the zijin mining area in 1992, 2014, 2018, and 2020.
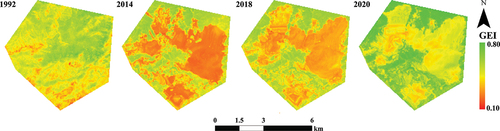
Figure 16. Change of GEI values over the study years in the zijin mining area.
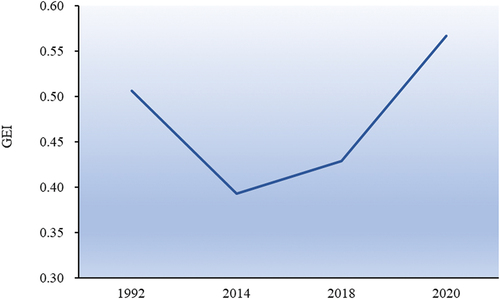
Table 3. Typical field inspection sites in the zijin mining area and their corresponding GEI values.
Figure 17. Comparison of the standard false-color synthesized gaofen-1 16m-resolution images with the GEI 30m-resolution image. (a) Entire area validation, left: gaofen-1 image, right: GEI image; (b) local area validation (area 1); and (c) local area validation (area 2).
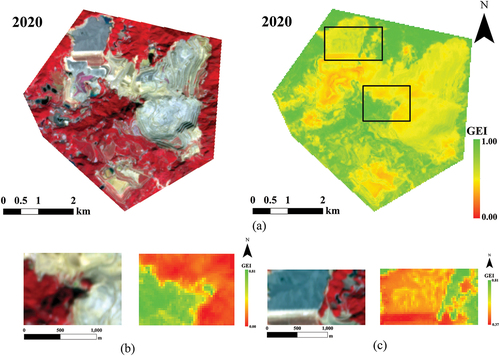
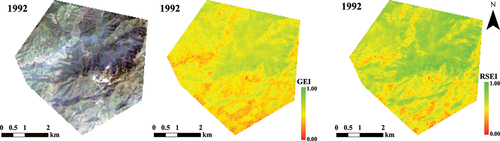
Figure 18. Original image (left), GEI image (centre), and RSEI image (right) of the zijin mining area in 1992.