Figures & data
Figure 5. Mean NRS ratings by Setting and Time of Test. Error bars reflect 1 SE of the mean.
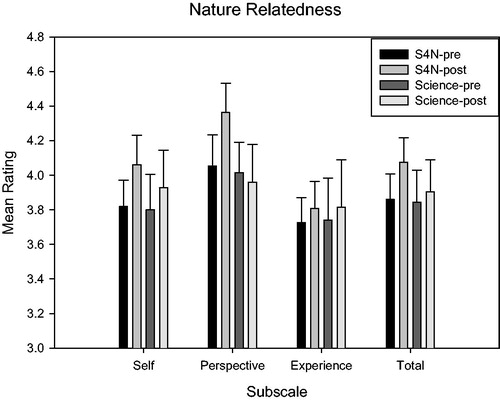
Figure 6. Mean ratings for PANAS & EES by Setting and Time of Test. Error bars reflect 1 SE of the mean.
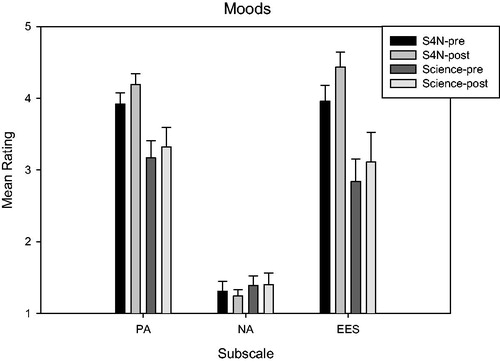
Figure 7. Mean DASS-21 ratings by Setting and Time of Test. Error bars reflect 1 SE of the mean.
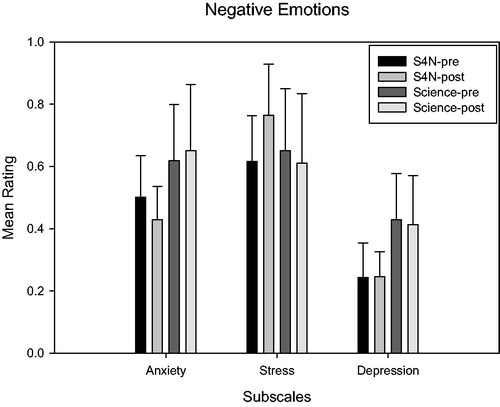
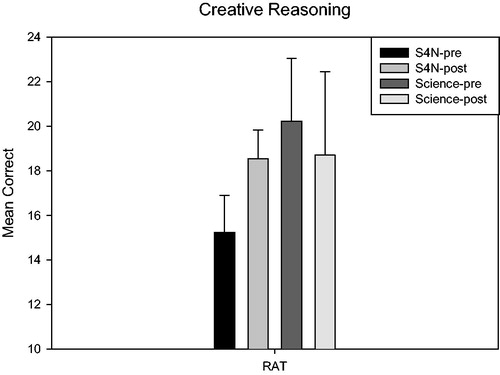
Figure 8. Mean number of associates generated by Setting and Time of Test. Error bars reflect 1 SE of the mean.