
Figures & data
Figure 1. Timing of the seminars and surveys across the professional development program.
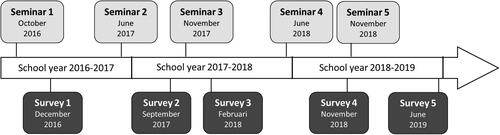
Table 1. Sample and basic demographics from respondents at each data collection moment.
Table 2. Descriptive results (M ± SD) for teachers’ self-efficacy beliefs at the five time points.
Table 3. Descriptive results (M ± SD) for teachers’ self-reported ESD practices at the five time points.
Figure 2. Changes in teachers’ self-efficacy for ESD and self-reported ESD practices across the five time points in the professional development program.
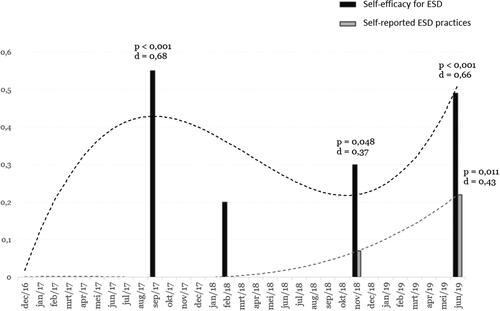
Table 4. Mean values, standard deviations, effect size and correlations between SEFF and PRAC at the five time points.
Data availability statement
Data supporting the findings of this study are available from the corresponding author upon reasonable request.