
Figures & data
Figure 1. Serengeti ecosystem showing the six study schools indicated with black dots: Loliondo, Emanyata, Soitsambu, Samunge, Digodigo and Lake Natron, located in northern Tanzania (main map). A map of Tanzania (inserted to the lower left) shows the location of the Serengeti ecosystem in northern Tanzania.
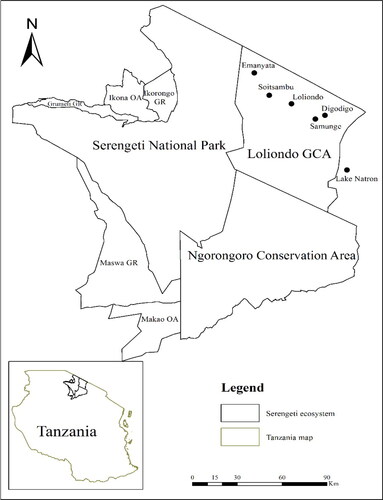
Table 1 . Percentage of the students who answered the question ‘What are ecosystem services?’ correct pre-test versus posttest1. We report parameter estimates from chi-square tests.
Table 2. Percentage of the students who identified ecosystem services and non-ecosystem services correctly pre-test and post-test. We report the percentage change in correct answers from pre- to post-test and parameter estimates from chi-tests assessing whether this change was larger than expected.
Table 3 . Percentage of the students who identified consequences of human population growth correctly pre-test and post-test.
Table 4. Percentage of respondents who answered correctly to the following alternatives from the question: ‘What are threats to biodiversity and ecosystem services?’ correctly pre-test and post-test.
Table 5. Percentage of respondents who answered correctly to the alternatives from the question ‘What are threats to ecosystem services?’ pre-test and post-test.
Table 6. Percentage of respondents who answered ‘yes’ to statements about nature and ecosystem services pre-test and post-test.