
Figures & data
Figure 1. Landscape Images.Sources: K’Gari (Fraser) Island: Fraser Coast Tourism & Events (https://www.fcte.com.au/); Blue Mountains: Tourism Australia (https://whc.unesco.org/en/list/917/gallery/ Author: Dominic Harcourt Webster).
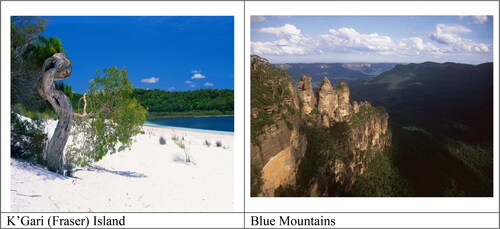
Table 1. Examples of the science, European human and indigenous creation stories used in the experiment.
Table 2. Results of principal components analysis of landscape perceptions.
Table 3. Results of principal components analysis of story evaluation statements.
Table 4. Results factorial ANOVA landscape by story conditions for landscape perception.
Table 5. Results factorial ANOVA landscape by story conditions for landscape preference.
Table 6. Results factorial ANOVA landscape by story conditions for intention to visit the landscape.
Table 7. Mean scores (Std. Dev) for types of landscape and story on perception, preference and visit.
Table 8. Results of Factorial ANOVA Landscape by story conditions with story Evaluation covariates for landscape perception.
Table 9. Results of factorial ANOVA landscape by story conditions with story evaluation covariates for landscape preference.
Table 10. Results of factorial ANOVA landscape by story conditions with story evaluation covariates for intention to visit the landscape.
Table 11. Mean scores for place perception and informative assessments for stories across all conditions.
Table 12. Most commonly top ranked and least ranked stories.