
Figures & data
Figure 1. PRISMA flow diagram of systematic review methods based on Moher et al. (Citation2009).
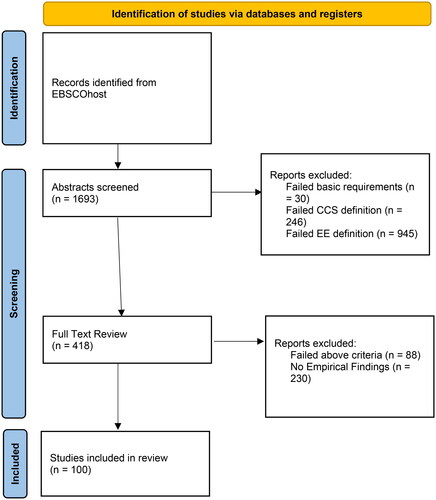
Figure 2. Keyword Boolean code search criteria.
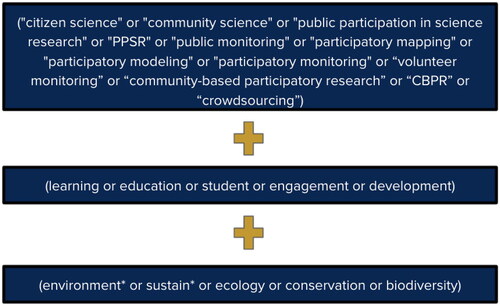
Table 1. Example main codes for analysis of empirical articles.
Table 2. Environmental education learning outcomes and definitions.
Figure 3. Number of articles reporting participants taking part in of the main scientific research activities of CCS.
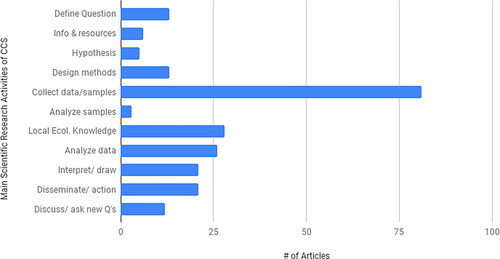
Table 3. Number of articles with participants engaging in clustered scientific research activities of CCS.
Table 4. Number of articles reporting learning outcomes (all positive outcomes except for *knowledge of nature of science and interest in science or environment).
Table 5. EE learning outcomes by clustered scientific research activities of CCS.
Figure 4. Number of empirical articles on CCS for EE published 2003–2018.
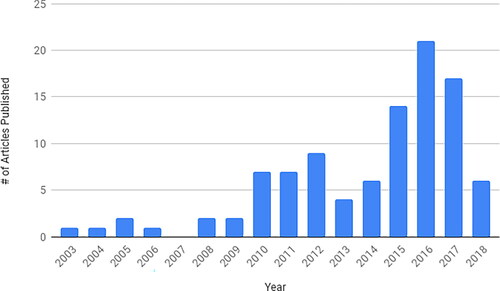
Table 6. Research designs used in studies of CCS for EE.
Table 7. Data collection methods used (n = 100).