
Figures & data
Table 1. Poverty rates by country, 2013.
Table 2. Decomposition of cross-country poverty rate-differences.
Figure A1. Quantile–quantile-plots for equivalent disposable income of the unemployed.
Source: Own calculation based on EU-SILC 2014
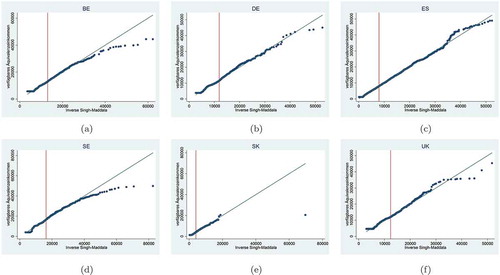
Table A1. Estimates of SM-distribution parameters by country.
Table A2. Individual and household characteristics of the unemployed (per cent).
Table A3. Estimates of distribution parameters by country.