Figures & data
Figure 1. Average non-performing loans ratio and FST-index, 2000–2011.
The left-hand side figure shows the FST-index for all countries in the sample and for countries with below/above median scores for the perceived corruption index. The right-hand side figure shows the average NPL ratio for all countries in the sample and for countries with below/above median scores for the FST-index.
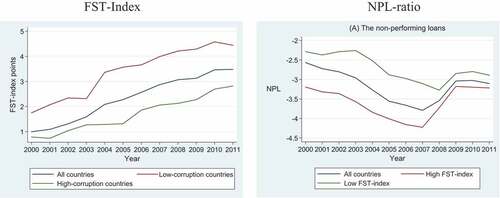
Table 1. Descriptive statistics of the variables (515 observations).
Table 2. The conditional effect of institutional quality on financial stability.
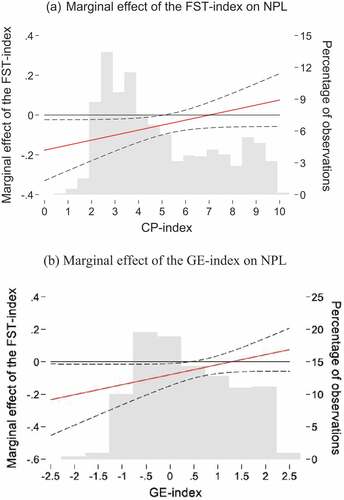
Figure 2. Marginal effect of the FST-index on NPL conditional on institutional quality.